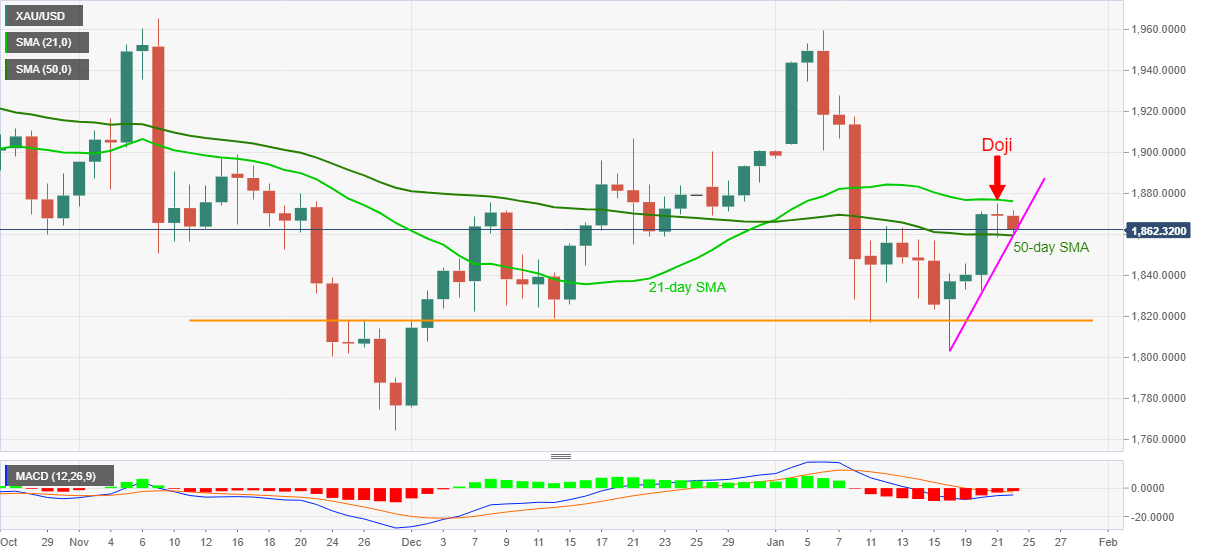
Gold Price Analysis: XAU/USD justifies Thursday’s doji below 21-DMA to drop towards $1,850


  • Gold extends previous day’s pullback to retest 50-day SMA, weekly support line.
  • Bearish MACD, trend reversal suggesting candlestick favor sellers.
  • Bulls can eye $1,900 beyond 21-day SMA, bears may aim for monthly low.

Gold bounces off intraday low of $1,859.00 to $1,862.10, down 0.37% on a day, during early Friday. The yellow metal refreshed two-week high the previous day but failed to cross a 21-day SMA.

The resulted moves portrayed a Doji candlestick on the daily (D1) chart, which in turn gained support from the bearish MACD signals to portray today’s downtick.

However, gold sellers seem to struggle off-late as 50-day SMA and an upward sloping trend line from Monday limits immediate declines around $1,859.

Considering the latest risk-off mood, coupled with Thursday’s Doji and bearish MACD, the bullion is expected to break the $1,859 support confluence, which in turn can direct the sellers toward $1,840.

Read: Gold Price Analysis: XAU/USD bulls catch a breather above $1,850 amid virus woes

Though, a horizontal area around $1,818 will question the commodity’s downside past-$1,840, if not then the monthly low near $1,802 and the $1,800 threshold will be in the spotlight.

Meanwhile, a daily closing beyond the 21-day SMA level of $1,876 will attack the $1,900 round-figure before confronting the key hurdle around $1,965 comprising highs marked in November and January.

Overall, the gold prices are likely to trim some of the latest gains but the overall uptrend is less likely to be affected.

Gold daily chart

Trend: Further declines expected

Additional important levels

Overview
Today last price 1863.21
Today Daily Change -5.91
Today Daily Change % -0.32%
Today daily open 1869.12
 
Trends
Daily SMA20 1876.86
Daily SMA50 1860
Daily SMA100 1883.53
Daily SMA200 1846.86
 
Levels
Previous Daily High 1875.2
Previous Daily Low 1858.43
Previous Weekly High 1863.83
Previous Weekly Low 1816.96
Previous Monthly High 1906.87
Previous Monthly Low 1775.52
Daily Fibonacci 38.2% 1864.84
Daily Fibonacci 61.8% 1868.79
Daily Pivot Point S1 1859.97
Daily Pivot Point S2 1850.81
Daily Pivot Point S3 1843.2
Daily Pivot Point R1 1876.74
Daily Pivot Point R2 1884.35
Daily Pivot Point R3 1893.51


Share: Feed news

Information on these pages contains forward-looking statements that involve risks and uncertainties. Markets and instruments profiled on this page are for informational purposes only and should not in any way come across as a recommendation to buy or sell in these assets. You should do your own thorough research before making any investment decisions. FXStreet does not in any way guarantee that this information is free from mistakes, errors, or material misstatements. It also does not guarantee that this information is of a timely nature. Investing in Open Markets involves a great deal of risk, including the loss of all or a portion of your investment, as well as emotional distress. All risks, losses and costs associated with investing, including total loss of principal, are your responsibility. The views and opinions expressed in this article are those of the authors and do not necessarily reflect the official policy or position of FXStreet nor its advertisers. The author will not be held responsible for information that is found at the end of links posted on this page.

If not otherwise explicitly mentioned in the body of the article, at the time of writing, the author has no position in any stock mentioned in this article and no business relationship with any company mentioned. The author has not received compensation for writing this article, other than from FXStreet.

FXStreet and the author do not provide personalized recommendations. The author makes no representations as to the accuracy, completeness, or suitability of this information. FXStreet and the author will not be liable for any errors, omissions or any losses, injuries or damages arising from this information and its display or use. Errors and omissions excepted.

The author and FXStreet are not registered investment advisors and nothing in this article is intended to be investment advice.

Recommended content


Recommended content

Editors’ Picks

AUD/USD tumbles toward 0.6350 as Middle East war fears mount

AUD/USD tumbles toward 0.6350 as Middle East war fears mount

AUD/USD has come under intense selling pressure and slides toward 0.6350, as risk-aversion intensifies following the news that Israel retaliated with missile strikes on a site in Iran. Fears of the Israel-Iran strife translating into a wider regional conflict are weighing on the higher-yielding Aussie Dollar. 

AUD/USD News

USD/JPY breaches 154.00 as sell-off intensifies on Israel-Iran escalation

USD/JPY breaches 154.00 as sell-off intensifies on Israel-Iran escalation

USD/JPY is trading below 154.00 after falling hard on confirmation of reports of an Israeli missile strike on Iran, implying that an open conflict is underway and could only spread into a wider Middle East war. Safe-haven Japanese Yen jumped, helped by BoJ Governor Ueda's comments. 

USD/JPY News

Gold price jumps above $2,400 as MidEast escalation sparks flight to safety

Gold price jumps above $2,400 as MidEast escalation sparks flight to safety

Gold price has caught a fresh bid wave, jumping beyond $2,400 after Israel's retaliatory strikes on Iran sparked a global flight to safety mode and rushed flows into the ultimate safe-haven Gold. Risk assets are taking a big hit, as risk-aversion creeps into Asian trading on Friday. 

Gold News

WTI surges to $85.00 amid Israel-Iran tensions

WTI surges to $85.00 amid Israel-Iran tensions

Western Texas Intermediate, the US crude oil benchmark, is trading around $85.00 on Friday. The black gold gains traction on the day amid the escalating tension between Israel and Iran after a US official confirmed that Israeli missiles had hit a site in Iran.

Oil News

Dogwifhat price pumps 5% ahead of possible Coinbase effect

Dogwifhat price pumps 5% ahead of possible Coinbase effect

Dogwifhat price recorded an uptick on Thursday, going as far as to outperform its peers in the meme coins space. Second only to Bonk Inu, WIF token’s show of strength was not just influenced by Bitcoin price reclaiming above $63,000.

Read more

Forex MAJORS

Cryptocurrencies

Signatures