|

Gold Price Analysis: XAU/USD is nearing key resistance near $1560/oz

  • XAU/USD had a bullish run in 2019 and is starting 2020 at its highest since April 2013.
  • The level to beat for buyers is the 1560/1600 price zone.
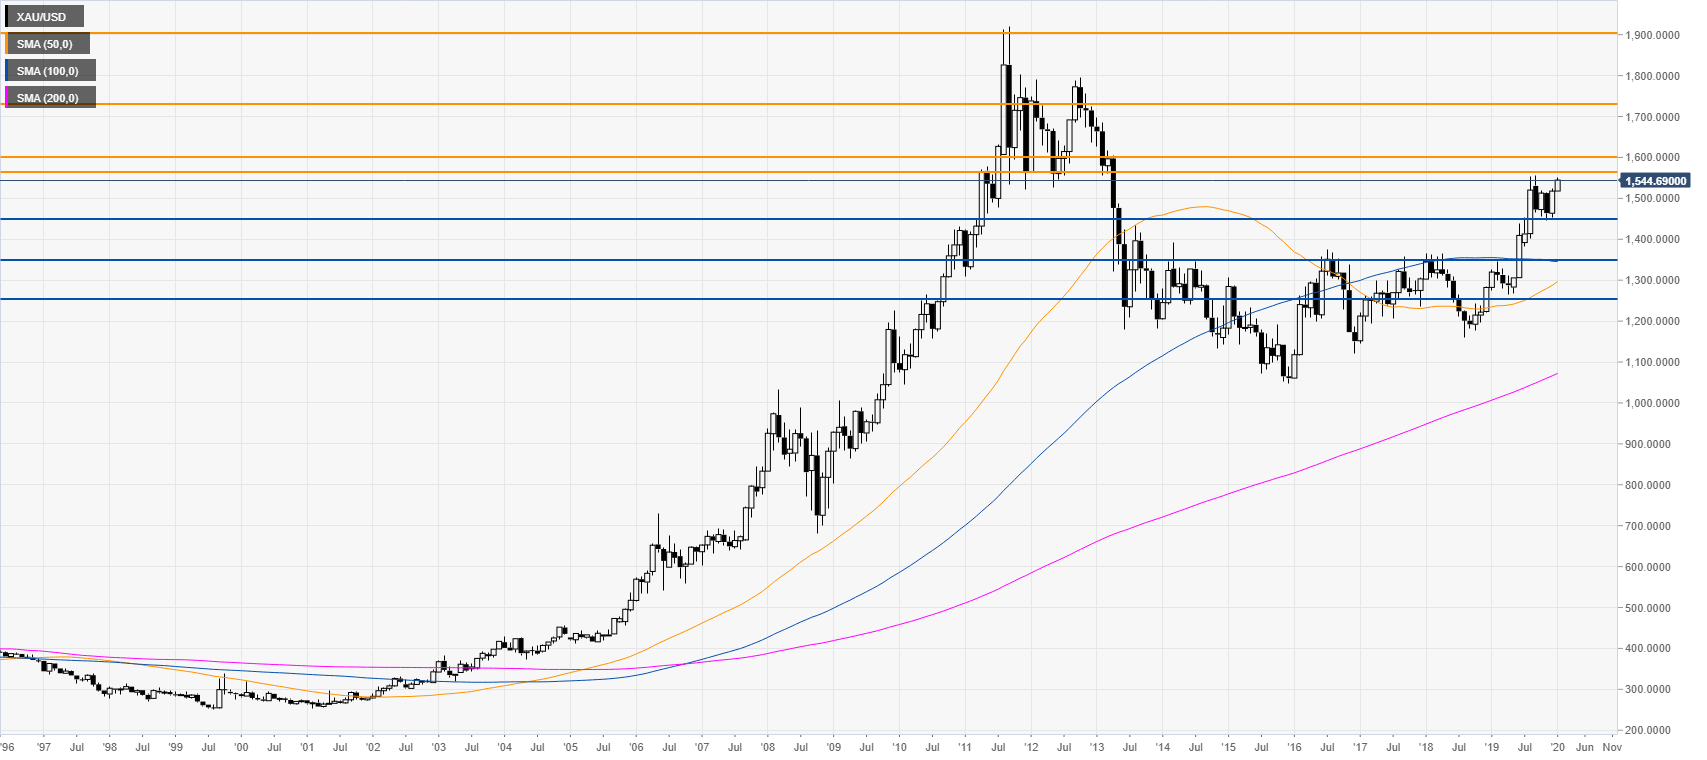
 

Gold monthly chart

 
The precious metal is trading in a bull trend above the main monthly simple moving averages (SMAs). In the last four months, it has been trading in a bull flag and if the bulls can have a convincing breakout above the 1560/1600 price zone, gold could rise towards the 1730 and 1900 resistance levels. 
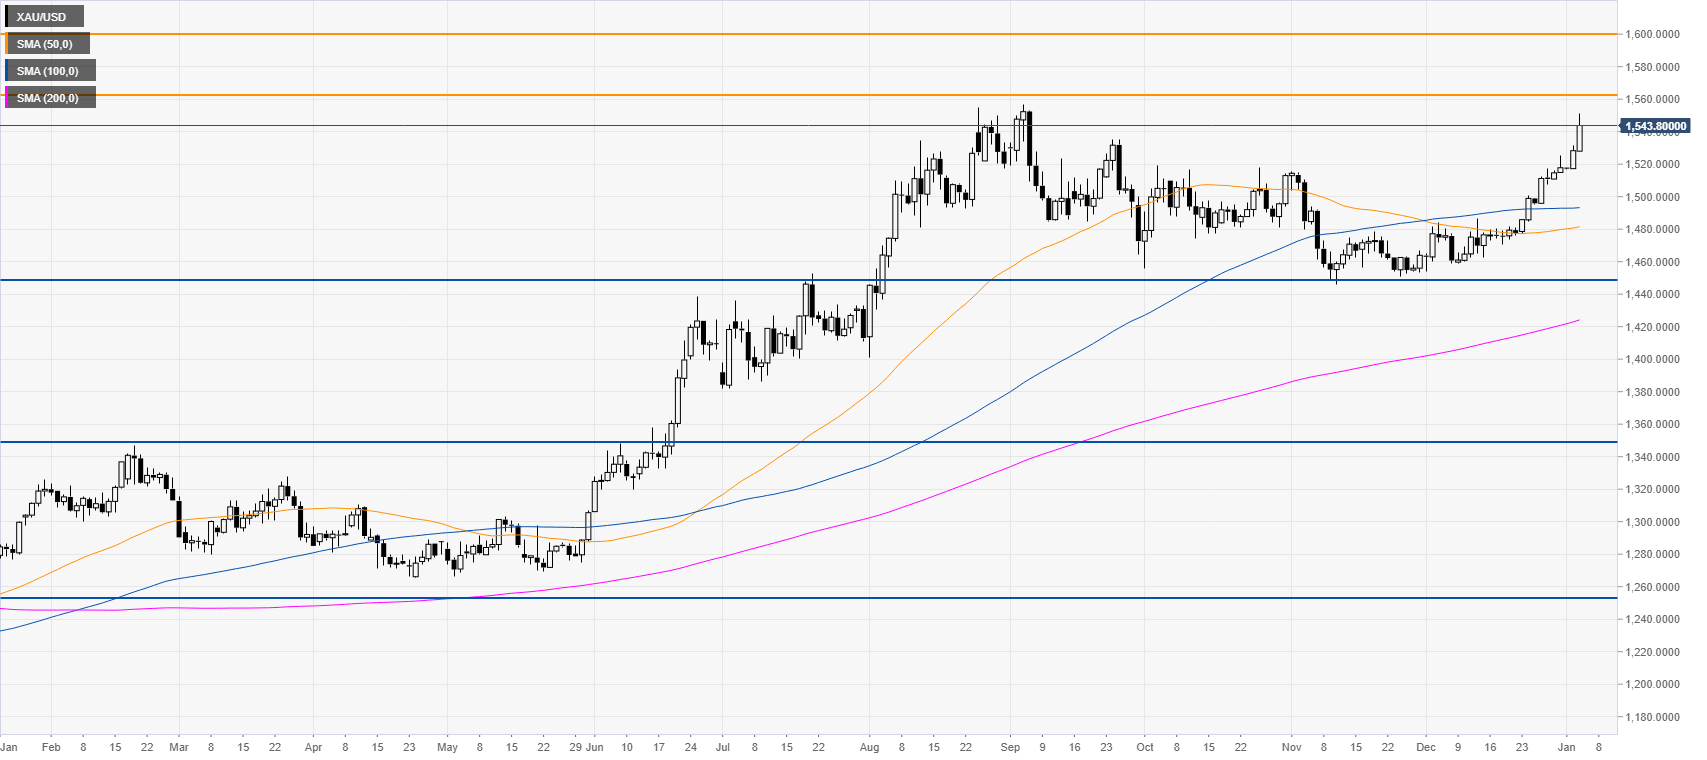
 

Gold daily chart

 
On the flip side, if the 1560/1600 price zone gets faded, gold is set to remain in the range of the last four months. In the event bears break 1445 support, the yellow metal could correct down and test the 1350 and 1250 levels. 
 

Additional key levels

XAU/USD

Overview
Today last price1546.5
Today Daily Change18.21
Today Daily Change %1.19
Today daily open1528.29
 
Trends
Daily SMA201488.69
Daily SMA501480.73
Daily SMA1001492.96
Daily SMA2001422.92
 
Levels
Previous Daily High1531.31
Previous Daily Low1517.24
Previous Weekly High1517.4
Previous Weekly Low1477.55
Previous Monthly High1525.1
Previous Monthly Low1454.05
Daily Fibonacci 38.2%1525.94
Daily Fibonacci 61.8%1522.61
Daily Pivot Point S11519.92
Daily Pivot Point S21511.54
Daily Pivot Point S31505.85
Daily Pivot Point R11533.99
Daily Pivot Point R21539.68
Daily Pivot Point R31548.06

Author

Flavio Tosti

Flavio Tosti

Independent Analyst


More from Flavio Tosti
Share:

Editor's Picks

EUR/USD remains offered below 1.1600, seems vulnerable near multi-month low

The EUR/USD pair struggles to capitalize on the overnight bounce from the 1.1530 region, or the lowest level since November 2025, and lower for the third consecutive day on Wednesday. Spot prices slide back below the 1.1600 mark during the Asian session and seem vulnerable to slide further.

GBP/USD slips below key averages as geopolitical risks mount

GBP/USD fell about 0.35% on Tuesday, settling around 1.3350 after slipping below the 200-day Exponential Moving Average for the first time since early December. The pair has pulled back sharply from its late-January high near 1.3870, shedding over 500 pips in a series of lower highs and lower lows. 

Gold bounces back toward $5.200 amid sustained safe-haven flows

Gold bounces back toward $5,200 in Wednesday's Asian session, moving away from an over one-week low. Sustained safe-haven flows, amid escalating geopolitical tensions in the Middle East, act as a tailwind for the bullion. However, a bullish US Dollar and reduced bets for more aggressive easing by the US Fed might keep a lid on the non-yielding yellow metal ahead of the US ADP report and ISM Services PMI data due later in the day.

Ethereum: Whales step up buying as short positions contract

After holding firm heading into the last weekend, Ethereum whales have returned to action, pouncing on the volatility stemming from escalating military actions between the US and Iran.

Energy shock 2.0: Why rising Gas prices could hit the Euro

Even without a confirmed, sustained disruption, the mere risk to a key global energy chokepoint is enough to inject a significant premium into European Gas markets. And for the Euro, that matters.

Ripple falters amid sell-off jitters and negative funding rates

Ripple (XRP) has come under pressure, drifting lower to $1.35 at the time of writing on Tuesday. The over 2% correction looks poised to erase the previous day’s gains, which lifted the remittance token to $1.42.