- Gold fell into the negative territory during the American session.
- USD stays resilient despite slumping Treasury bond yields.
- Key technical levels remain intact as XAU/USD struggles to find direction.
The XAU/USD pair closed the first day of the week in the positive territory and continued to push higher during the first half of the day on Tuesday. After touching a daily high of $1.903, however, the pair lost its traction and dropped all the way to $1,883 before going into a consolidation phase. As of writing, gold was losing 0.37% on a daily basis at $1,892.
Earlier in the day, the sharp decline witnessed in the US Treasury bond yields allowed gold to preserve its bullish momentum. Nevertheless, the cautious market mood helped the greenback stay resilient against its rivals on Tuesday and forced XAU/USD to reverse its direction. At the moment, the benchmark 10-year US T-bond yield is down more than 2% on the day at 1.53% but the US Dollar Index clings to modest gains at 90.12.
The data from the US revealed on Tuesday that the goods and services deficit declined by $6.1 billion to $68.9 billion in April. Additionally, the NFIB Business Optimism Index edged lower to 99.6 in May from 99.8 in April and the JOLTS Job Openings registered a new series high of 9.3 million April, compared to analysts' estimate of 8.3 million. These figures failed to trigger a noticeable market reaction.
Meanwhile, Wall Street's main indexes, which opened in the positive territory, are moving sideways near Monday's closing levels, reflecting a cautious market mood ahead of Thursday's Consumer Price Index (CPI) data.
Gold technical outlook
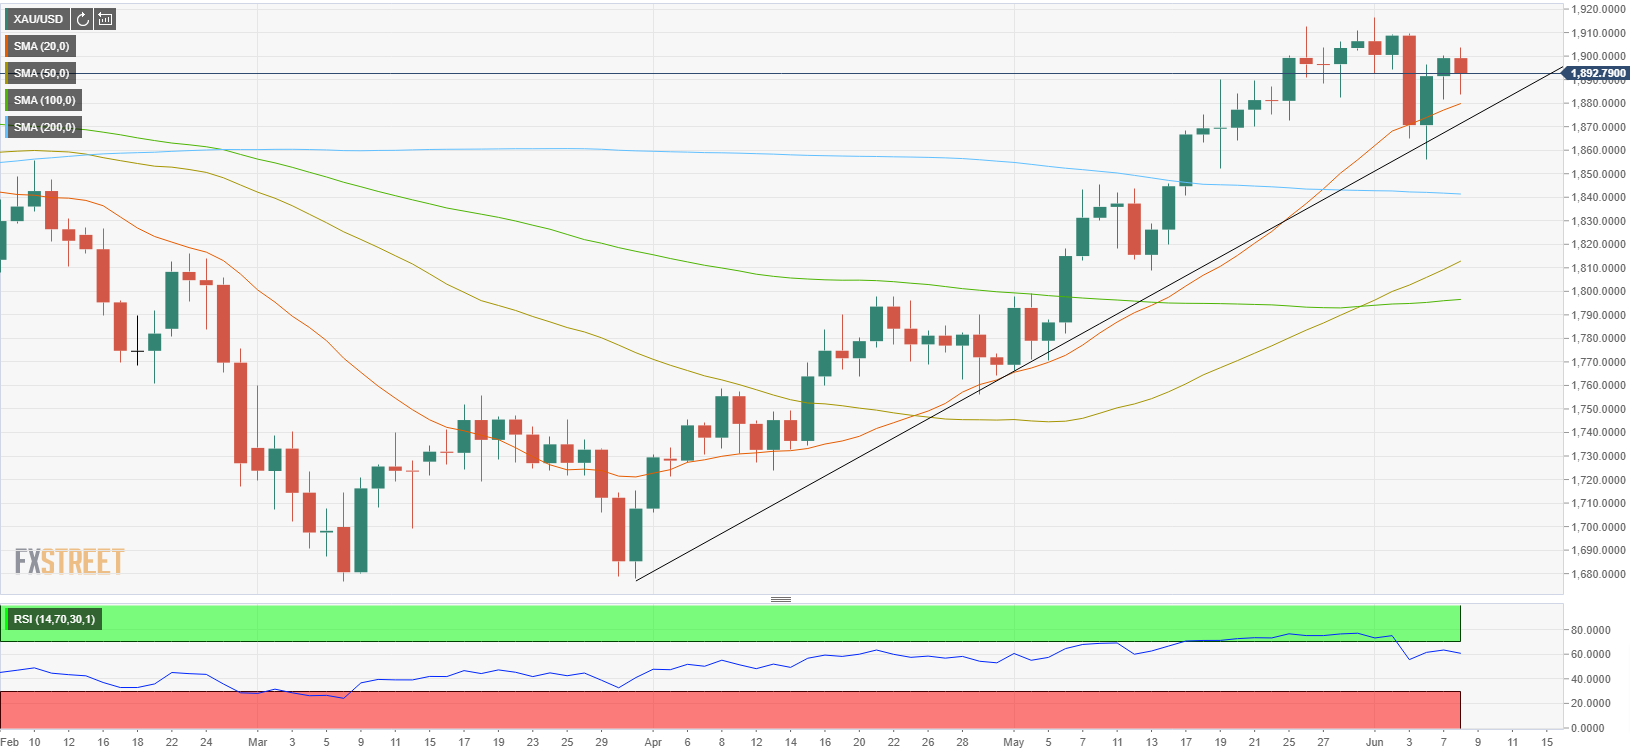
Following Tuesday's fluctuations, key technical remains for gold remain intact. On the upside, sellers continue to defend $1,900 (psychological level). Above that hurdle, the next resistance is located at $1,916 (June 1 high). Meanwhile, the Relative Strength Index (RSI) indicator on the daily chart is moving sideways near 60, suggesting that the pair is having a difficult time gathering directional momentum.
On the downside, the 20-day SMA, which is currently located at $1,880, continues to act as a dynamic support. A daily close below that level could allow gold to retest the ascending trend line coming from early April at $1,870. before the critical 200-day SMA at $1,840.
Additional levels to watch for
Information on these pages contains forward-looking statements that involve risks and uncertainties. Markets and instruments profiled on this page are for informational purposes only and should not in any way come across as a recommendation to buy or sell in these assets. You should do your own thorough research before making any investment decisions. FXStreet does not in any way guarantee that this information is free from mistakes, errors, or material misstatements. It also does not guarantee that this information is of a timely nature. Investing in Open Markets involves a great deal of risk, including the loss of all or a portion of your investment, as well as emotional distress. All risks, losses and costs associated with investing, including total loss of principal, are your responsibility. The views and opinions expressed in this article are those of the authors and do not necessarily reflect the official policy or position of FXStreet nor its advertisers. The author will not be held responsible for information that is found at the end of links posted on this page.
If not otherwise explicitly mentioned in the body of the article, at the time of writing, the author has no position in any stock mentioned in this article and no business relationship with any company mentioned. The author has not received compensation for writing this article, other than from FXStreet.
FXStreet and the author do not provide personalized recommendations. The author makes no representations as to the accuracy, completeness, or suitability of this information. FXStreet and the author will not be liable for any errors, omissions or any losses, injuries or damages arising from this information and its display or use. Errors and omissions excepted.
The author and FXStreet are not registered investment advisors and nothing in this article is intended to be investment advice.
Recommended content
Editors’ Picks
EUR/USD edges lower toward 1.0700 post-US PCE
EUR/USD stays under modest bearish pressure but manages to hold above 1.0700 in the American session on Friday. The US Dollar (USD) gathers strength against its rivals after the stronger-than-forecast PCE inflation data, not allowing the pair to gain traction.
GBP/USD retreats to 1.2500 on renewed USD strength
GBP/USD lost its traction and turned negative on the day near 1.2500. Following the stronger-than-expected PCE inflation readings from the US, the USD stays resilient and makes it difficult for the pair to gather recovery momentum.
Gold struggles to hold above $2,350 following US inflation
Gold turned south and declined toward $2,340, erasing a large portion of its daily gains, as the USD benefited from PCE inflation data. The benchmark 10-year US yield, however, stays in negative territory and helps XAU/USD limit its losses.
Bitcoin Weekly Forecast: BTC’s next breakout could propel it to $80,000 Premium
Bitcoin’s recent price consolidation could be nearing its end as technical indicators and on-chain metrics suggest a potential upward breakout. However, this move would not be straightforward and could punish impatient investors.
Week ahead – Hawkish risk as Fed and NFP on tap, Eurozone data eyed too
Fed meets on Wednesday as US inflation stays elevated. Will Friday’s jobs report bring relief or more angst for the markets? Eurozone flash GDP and CPI numbers in focus for the Euro.