Gold Price Analysis: XAU/USD eyes $1850 amid bull pennant breakout on 1H chart
- Gold extends recovery for the second straight session.
- Bull pennant breakout confirmed on the hourly chart.
- Hourly RSI peeps into the overbought territory.

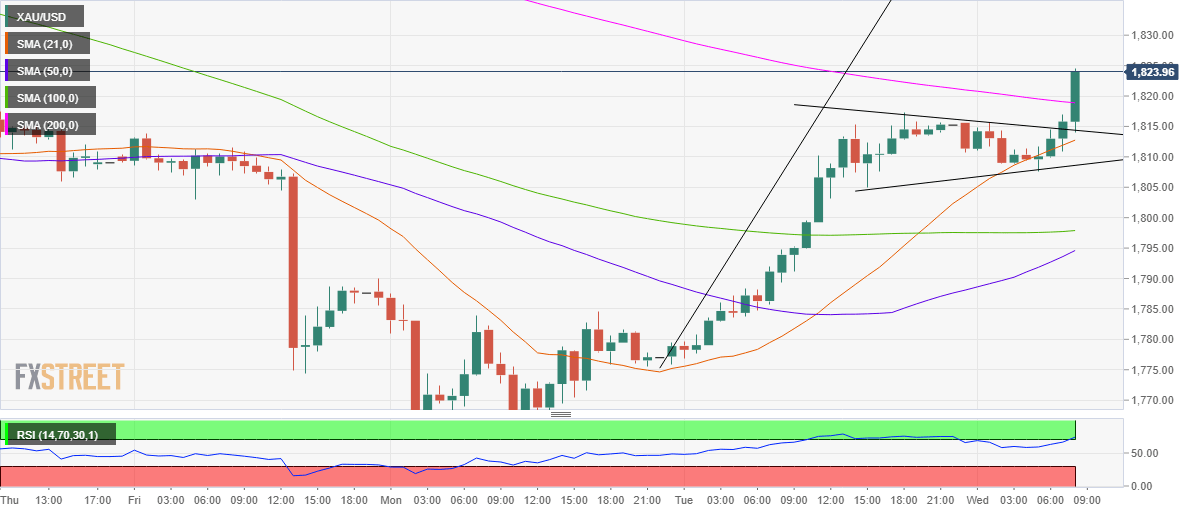
Gold’s recovery from five-month lows of $1765 gains further traction on Wednesday, as the bulls gear up for a test of the earlier critical support now resistance at $1850.
The technical set up favors the bulls, as the price confirmed a bull pennant breakout on the hourly chart in the last hour. The validation came in after the metal gave an hourly closing above the falling trendline resistance at $1815.
The price pierced above the 200-hourly moving average (HMA) at $1819, offering extra zest to the XAU bulls after the big breakout.
The hourly Relative Strength Index (RSI) marches into the overbought territory, currently at 74.05, implying that the price could reverse to test the 200-HMA before resuming its upward journey towards the $1850 level.
A breach of the 200-HMA could expose the pattern resistance now support at $1815. The next downside target for the bears is seen at the bullish 21-HMA at $1812.
The recovery momentum remains intact so long as the precious metal holds above the $1800 level.
Gold Price Chart: Hourly
Gold: Additional levels
Author

Dhwani Mehta
FXStreet
Residing in Mumbai (India), Dhwani is a Senior Analyst and Manager of the Asian session at FXStreet. She has over 10 years of experience in analyzing and covering the global financial markets, with specialization in Forex and commodities markets.


