|

Gold Price Analysis: XAU/USD drops sharply to $1550/oz

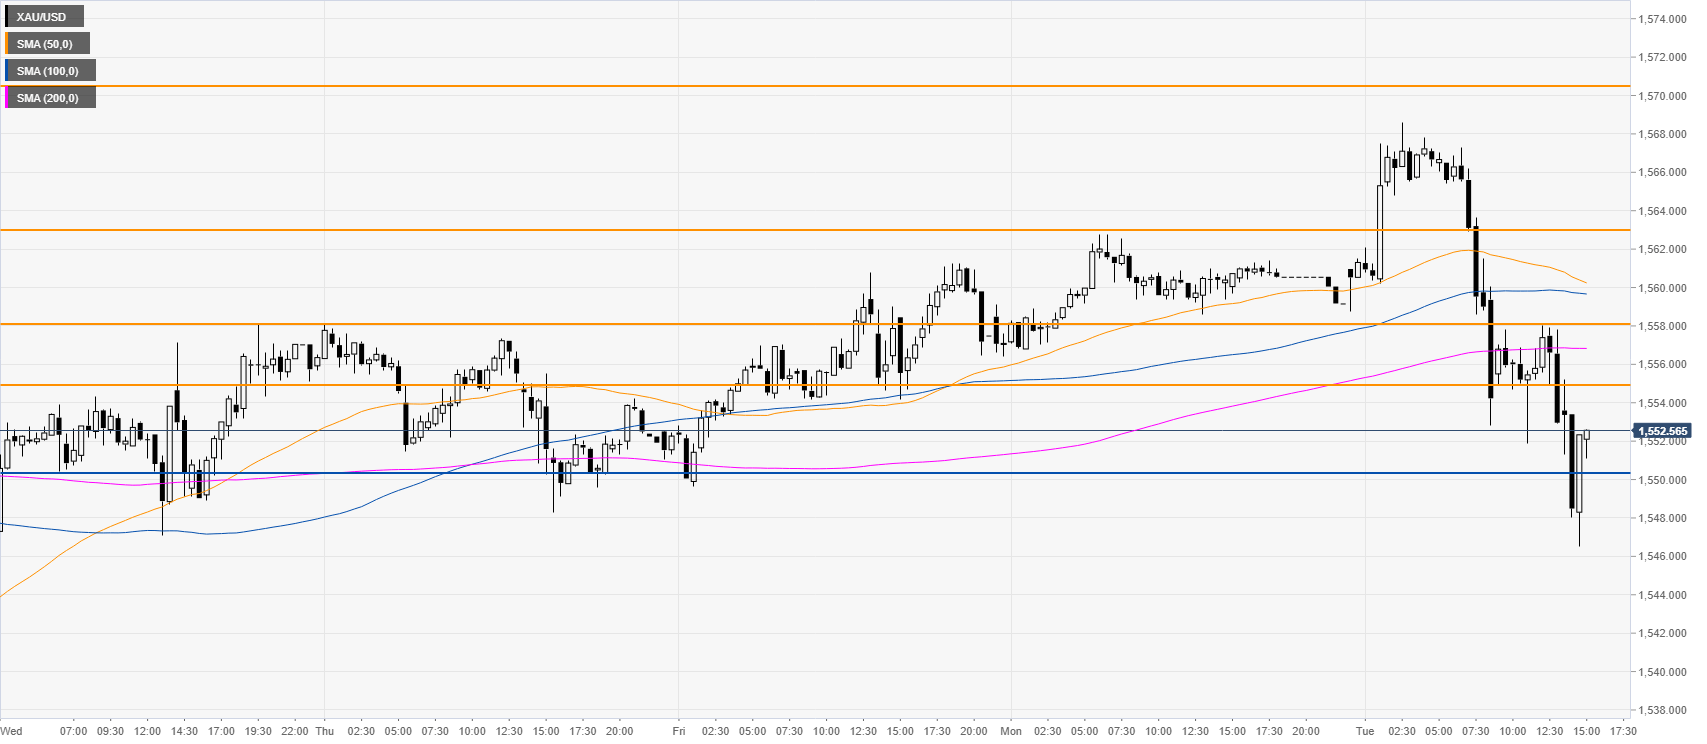
  • Gold is trading in the New York session below the 1558/1555 resistance zone.
  • The level to beat for bears is the 1550 support.
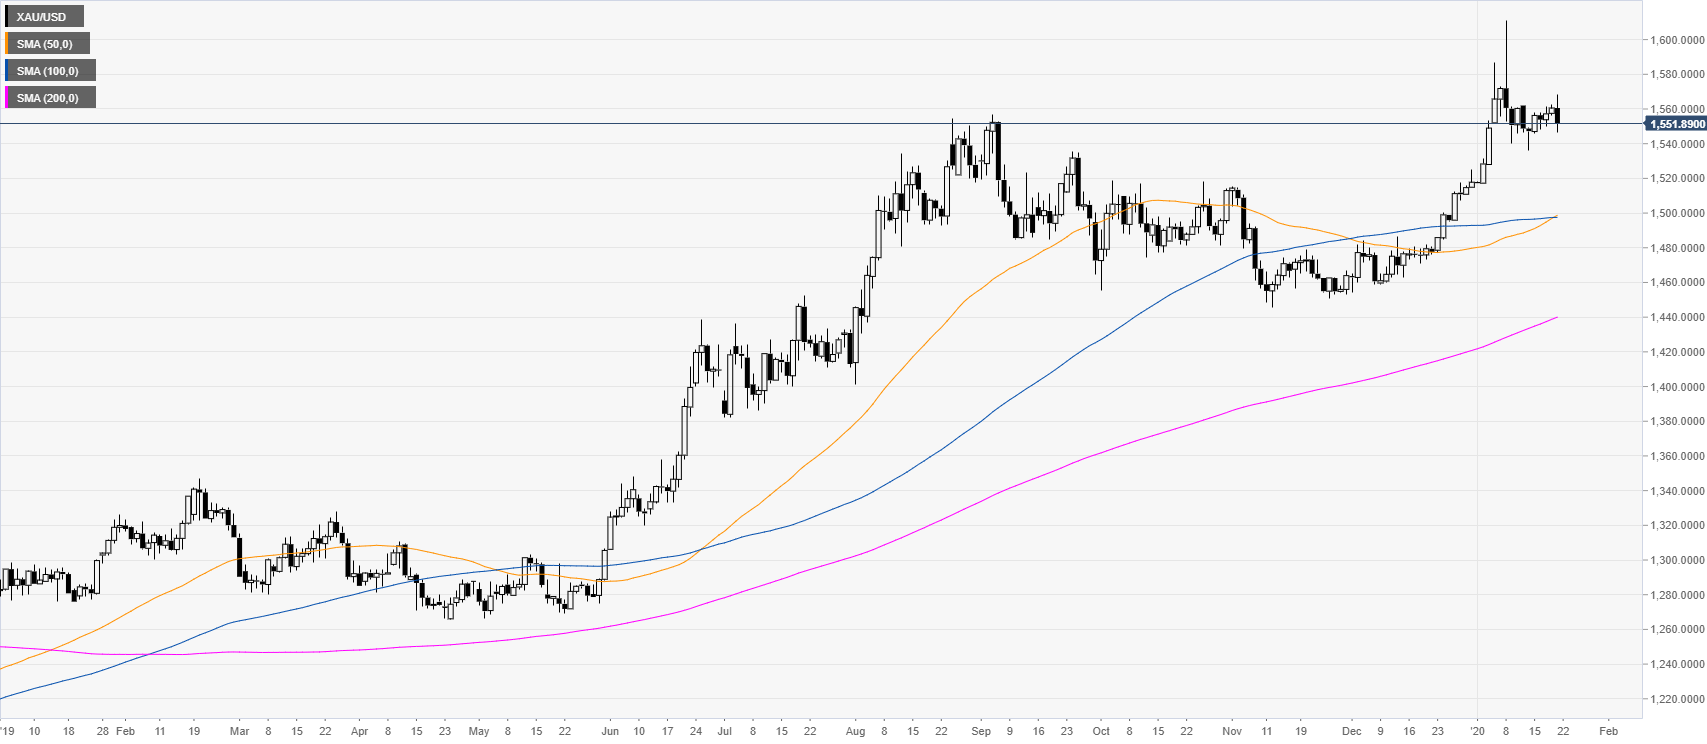
 

Gold daily chart

 
XAU/USD is trading in a bull trend above its main daily simple moving averages (SMAs). After a failure at the 1600 mark earlier in the month, the metal is now in consolidation mode.
 

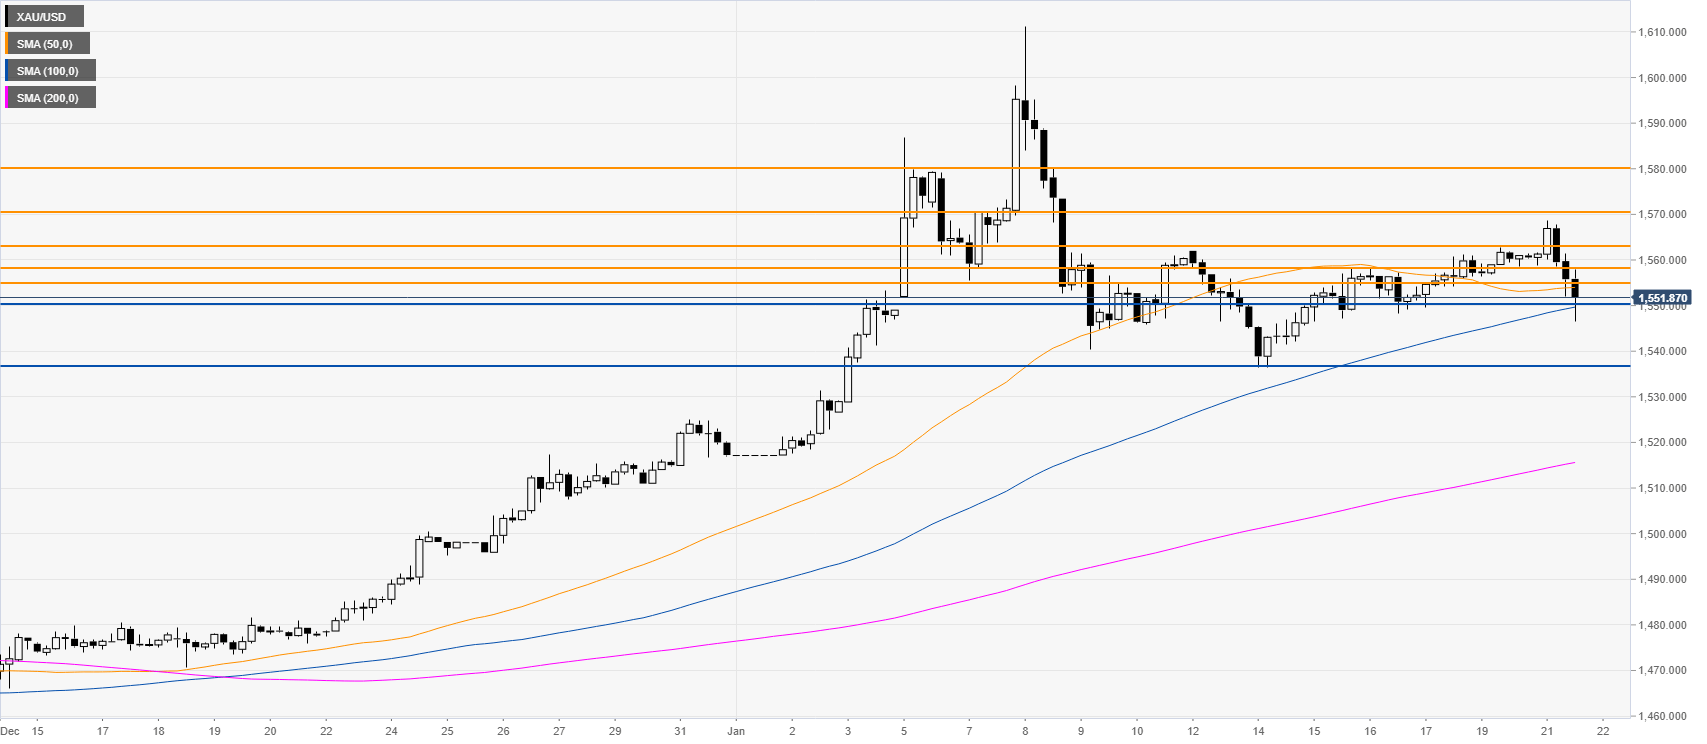
Gold four-hour chart

 
Gold is retracing down challenging the 1550 support and the 100 SMA on the four-hour chart. If the markets break below the 1550 level it can continue to decline towards the 1537 support level. 


Gold 30-minute chart

 
The market is trading below the main SMAs suggesting a bearish momentum in the near term. The bullish bias got invalidated below the 1558/1555 price zone as it lead to a deeper retracement towards the 1550 level as expected. The market could remain under selling pressure in the near term with a hard time to recover above the 1558/1555 price zone. 


Additional key levels

XAU/USD

Overview
Today last price1552.33
Today Daily Change-8.23
Today Daily Change %-0.53
Today daily open1560.56
 
Trends
Daily SMA201538.85
Daily SMA501496.89
Daily SMA1001497.46
Daily SMA2001438.73
 
Levels
Previous Daily High1562.78
Previous Daily Low1556.4
Previous Weekly High1562
Previous Weekly Low1536.35
Previous Monthly High1525.1
Previous Monthly Low1454.05
Daily Fibonacci 38.2%1560.34
Daily Fibonacci 61.8%1558.84
Daily Pivot Point S11557.05
Daily Pivot Point S21553.54
Daily Pivot Point S31550.67
Daily Pivot Point R11563.42
Daily Pivot Point R21566.29
Daily Pivot Point R31569.8

Author

Flavio Tosti

Flavio Tosti

Independent Analyst


More from Flavio Tosti
Share:

Editor's Picks

EUR/USD remains heavy near 1.1600 after hot EU inflation data

EUR/USD remains heavily offered near 1.1600, six-week lows, in the European session on Tuesday. The pair fails to find any inspiration from a surprise pick up in Eurozone inflation for February, as the US Dollar continues to attract safe haven flows amid escalating geopolitical tensions in the Middle East. 

GBP/USD attacks 1.3300, refreshing three-month lows

GBP/USD is deep in the red near 1.3300, accelerating its downside to renew three-month lows in European trading on Tuesday. The ongoing escalation in the Iran war, combined with rising Oil prices, weighs negatively on the higher-yielding Pound Sterling as the US Dollar capitalizes on increased haven demand.

Gold falls below $5,300 as stronger USD counter Middle East woes

Gold attracts some intraday selling and falls below $5,300 on Tuesday. The US Dollar climbs to a fresh high since January 20 and turns out to be a key factor exerting downward pressure on the commodity. However, concerns about a broader regional conflict in the Middle East continue to weigh on investors' sentiment and underpin demand for the traditional safe-haven bullion.

Stellar risks deeper losses as derivatives metrics turn negative

Stellar is trading red below $0.16 at the time of writing on Tuesday, after a slight recovery the previous day. Weakening derivatives data caps the recovery, while an unfavorable technical outlook projects a deeper correction for the XLM token in the upcoming days.

Middle East conflict ramps up a gear as energy price spike rips through markets

It’s another risk off day as geopolitical headwinds continue to batter financial markets. Although markets calmed during the US session and US stocks managed to post gains on Monday, this has not fed through to the European session, and stocks and bonds are sharply lower for a second day.

Hyperliquid Price Forecast: HYPE rises on commodities demand amid US-Iran war

Hyperliquid (HYPE) steadies above $33 at press time on Tuesday, marking its fourth consecutive day of recovery in a broadly volatile market due to the ongoing US-Israel strikes on Iran.