|

Gold Price Analysis: XAU/USD down 0.45%, but losses could be short-lived

  • Gold is nursing moderate losses at press time, having gained 1.27% on Weddnesday. 
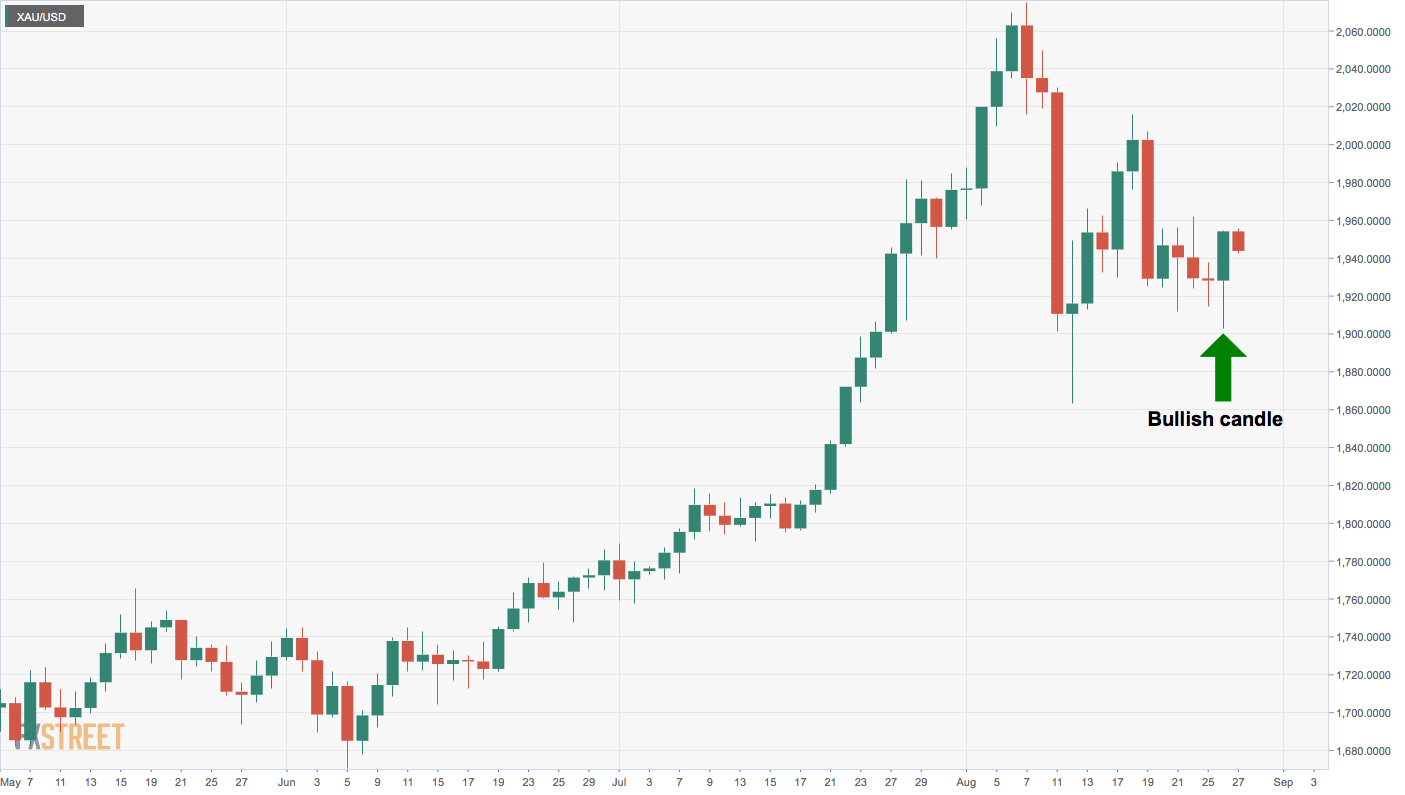
  • Gold's daily chart shows a bullish candlestick arrangement. 

Gold is trading near $1,945 per ounce, representing a 0.45% decline on the day. The losses could be reversed during the day ahead as the daily chart is reporting a bullish reversal pattern. 

The metal first created a Doji candle on Tuesday, indicating indecision in the marketplace and then carved out a long-tailed bullish engulfing candle on Wednesday. 

In other words, the market has gone from being indecisive to bullish. 

As such, the hourly chart resistance at $1,962 could come into play. Acceptance above that level would open the doors for $2,000.

The bullish bias would be invalidated if prices settle below $ 1,903 – the low of the long-tailed positive engulfing candle created on Wednesday. A close below $1,903 will likely invite stronger selling pressure, possibly yielding a drop to $1,863 (Aug. 12 low). 

Daily chart

Trend: Bullish

Technical levels

XAU/USD

Overview
Today last price1944.94
Today Daily Change-9.24
Today Daily Change %-0.47
Today daily open1954.18
 
Trends
Daily SMA201971.76
Daily SMA501876.23
Daily SMA1001795.17
Daily SMA2001673.81
 
Levels
Previous Daily High1954.88
Previous Daily Low1902.76
Previous Weekly High2015.65
Previous Weekly Low1911.64
Previous Monthly High1984.8
Previous Monthly Low1757.7
Daily Fibonacci 38.2%1934.97
Daily Fibonacci 61.8%1922.67
Daily Pivot Point S11919.67
Daily Pivot Point S21885.15
Daily Pivot Point S31867.55
Daily Pivot Point R11971.79
Daily Pivot Point R21989.39
Daily Pivot Point R32023.91

Author

Omkar Godbole

Omkar Godbole

FXStreet Contributor

Omkar Godbole, editor and analyst, joined FXStreet after four years as a research analyst at several Indian brokerage companies.

More from Omkar Godbole
Share:

Editor's Picks

EUR/USD hovers around nine-day EMA above 1.1800

EUR/USD gains ground for the second successive session, trading around 1.1820 during the Asian hours on Monday. The 14-day Relative Strength Index momentum indicator stands at 51 (neutral) after recovering above the midline, indicating stabilizing momentum. 

GBP/USD gathers strength above 1.3500 amid tariff confusion

The GBP/USD pair gains traction to around 1.3520 during the early Asian session on Monday. The US Dollar faces some selling pressure against the Cable as tariff uncertainty lingers. Traders will take more cues from the US Producer Price Index report for January, which will be published later on Friday. 

Gold climbs to fresh monthly high on trade war fears, geopolitical risks, weaker USD

Gold registered its highest-ever weekly close, above the $5,100 mark on Friday, and gains strong follow-through traction at the start of a new week. This also marks the fourth straight day of a positive move and lifts the commodity beyond the $5,150 level, or a fresh monthly peak, during the Asian session. 

Cardano braces for impact as US tariff storm brews

Cardano is down 4% at press time on Monday, entering its third consecutive day of decline. Bearish bias in Cardano’s derivatives market positional buildup aligns with rising pressure on the broader cryptocurrencymarket amid US President Donald Trump's reassessment of global tariffs and domestic conflict with the US Supreme Court. 

Liberation day take two, the tariff machine just changed gears

Let me caveat this from the outset. What we are watching is first-order mechanics, not the grand macro endgame. This is the market’s immediate reflex to a 15% Trump tariff levy dressed up as judicial drama. The Supreme Court blocked Trump tarrif hammer. The White House came back with a scalpel.

Top Crypto Losers: Zcash, Pump.fun, and LayerZero extended losses as Bitcoin loses $65,000

The cryptocurrency market starts the week in panic mode, with altcoins Zcash, Pump.fun, and LayerZero. Bitcoin falls below $65,000 as the US President Donald Trump regroups amid renewed trade policy risks.