Gold Price Analysis: XAU/USD cracks key $1857 support as USD firms up, levels to watch – Confluence Detector

Gold (XAU/USD) has erased early gains and turns south on Tuesday, as the haven demand for the US dollar is back on the rise amid escalating American-Sino tensions. Strains between the world’s two biggest economies resurfaced over the South China Sea issue after a US carrier group entered the disputed waters last week.
Also, fading prospects of US President Biden’s $1.9 trillion stimulus plan likely to be passed by US Congress keep sentiment around gold undermined. Worsening risk-aversion ahead of the critical US Durable Good and Consumer Confidence data will keep any upside attempts in the metal elusive.
Let’s see how gold is positioned on the technical charts?
Gold Price Chart: Key resistances and supports
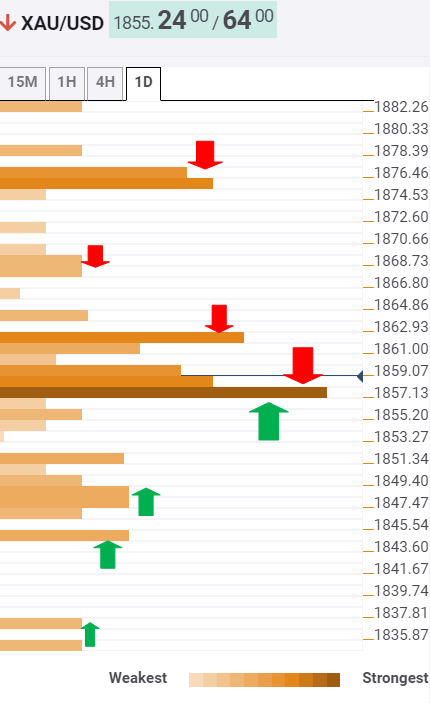
The Technical Confluences Indicator shows that gold has breached critical support at $1857, where the Fibonacci 38.2% one-month converged with the SMA50 one-hour.
The next relevant support awaits at $1851, the SMA10 one-day.
On a break below the latter, the price is likely to face a dense cluster of support levels around $1848, which is the intersection of the previous day low, SMA200 one-day and Fibonacci 38.2% one-week.
The bears could challenge the $1837 cushion, the pivot point one-day S2 if the selling pressure intensifies.
On the flip side, recapturing a powerful $1857 barrier is critical to extending the recovery towards $1863, the previous high four-hour.
Further north, the previous day high at $1867 could be back on the bulls’ radar.
The intersection of the previous week high and Fibonacci23.6% one-month around $1876 will be the level to beat for the XAU bears.
Here is how it looks on the tool
About Confluence Detector
The TCI (Technical Confluences Indicator) is a tool to locate and point out those price levels where there is a congestion of indicators, moving averages, Fibonacci levels, Pivot Points, etc. Knowing where these congestion points are located is very useful for the trader, and can be used as a basis for different strategies.
Author

Dhwani Mehta
FXStreet
Residing in Mumbai (India), Dhwani is a Senior Analyst and Manager of the Asian session at FXStreet. She has over 10 years of experience in analyzing and covering the global financial markets, with specialization in Forex and commodities markets.


