|

Gold Price Analysis: XAU/USD charts a narrowing price range near the 200-day SMA

  • Gold defends the widely-tracked 200-day SMA support.
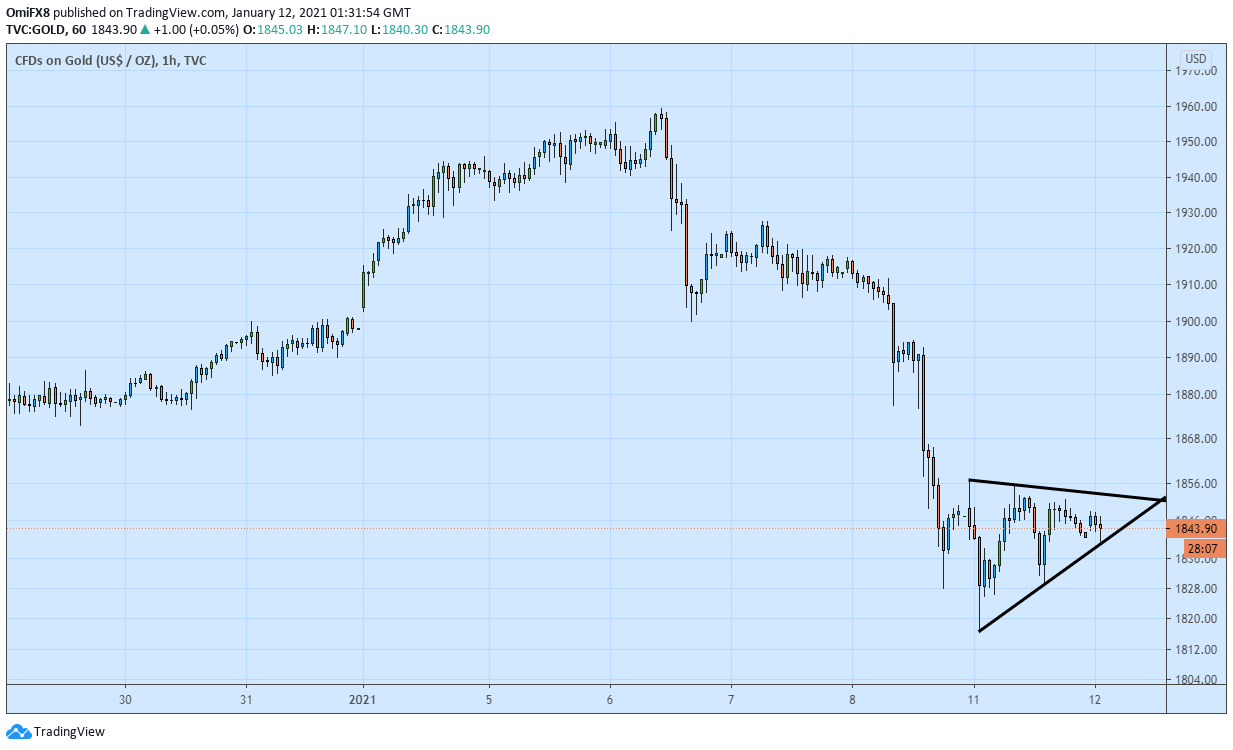
  • The hourly chart shows a narrowing price range or pennant pattern. 

Gold is trading largely unchanged on the day near $1,845 per ounce. The sellers failed to establish a foothold below the 200-day Simple Moving Average (SMA) for the second straight trading day on Monday. The average is currently located at $1,838. 

The yellow metal has carved out a pennant pattern on the hourly chart. A downside break would imply a continuation of the sell-off from $1,940 and open the doors to a re-test of Monday's low of $1,816. A violation there would expose the psychological level of $1,800.

On the other hand, a triangle breakout would validate the seller fatigue signaled by the long tail attached to Monday's daily candle and allow a bounce to the former support-turned-resistance near $1,870. 

Hourly chart

Trend: Neutral 

Technical levels

XAU/USD

Overview
Today last price1845.04
Today Daily Change-0.22
Today Daily Change %-0.01
Today daily open1845.26
 
Trends
Daily SMA201885.83
Daily SMA501867.93
Daily SMA1001891.46
Daily SMA2001840.44
 
Levels
Previous Daily High1856.82
Previous Daily Low1816.96
Previous Weekly High1959.42
Previous Weekly Low1828.27
Previous Monthly High1906.87
Previous Monthly Low1775.52
Daily Fibonacci 38.2%1832.19
Daily Fibonacci 61.8%1841.59
Daily Pivot Point S11822.54
Daily Pivot Point S21799.82
Daily Pivot Point S31782.68
Daily Pivot Point R11862.4
Daily Pivot Point R21879.54
Daily Pivot Point R31902.26

Author

Omkar Godbole

Omkar Godbole

FXStreet Contributor

Omkar Godbole, editor and analyst, joined FXStreet after four years as a research analyst at several Indian brokerage companies.

More from Omkar Godbole
Share:

Editor's Picks

AUD/USD picks up amid easing geopolitical tensions, bright data from China

The Australian Dollar posts moderate gains against the US Dollar on Tuesday, regaining some of the ground lost last week, although it remains at its lowest level in nearly two months. News that Israel and Iran halted hostilities has triggered a mild relief rally. At the same time, upbeat Chinese trade data has provided additional support for the Aussie, as China is Australia’s major trading partner.

Japanese Yen steadies near recent lows as ceasefire, Japan intervention threats offset

USD/JPY trades around 160.15 on Tuesday, remaining close to its highest level since April 30 despite a broadly neutral intraday performance. The pair retains an underlying bullish bias, supported by expectations that US monetary policy will remain restrictive, although upside potential is being capped by the risk of intervention from Japanese authorities.

Gold dives to fresh two-month lows, aims to challenge $4,000

The selling pressure now gathers extra pace and sends Gold to new three-month lows near $4,230 per troy punce on Tuesday. That said, the yellow metal resumes its decline on the back of a recovery attempt in the US Dollar and the likelihood of a tighter-for-longer Fed this year.

Crypto Today: Bitcoin, Ethereum, XRP edge lower despite Middle East tensions easing

Cryptocurrency prices trade amid persistent selling pressure on Tuesday. Bitcoin (BTC) hovers near $63,000, Ethereum (ETH) above $1,650, and Ripple (XRP) around $1.14.

Hotter US inflation numbers could further bolster Fed hike bets

Middle East tensions keep inflation risks elevated. Fed hike fully priced in by year end amid strong NFP report. US CPI data on Wednesday (12:30 GMT) to enter the spotlight. Further acceleration in inflation could drive the Dollar higher.

The US economy defies the rules: 100 days into the Oil shock and the recession signal is still missing

More than three months after the start of the Iran war and the resulting disruption to global energy markets, the US economy continues to display remarkable resilience. The conflict has triggered a sharp rise in Oil prices, reignited inflationary pressures and fueled widespread concerns about a potential economic slowdown.