Gold Price Analysis: XAU/USD battles 50-HMA on the road to recovery


  • Gold consolidates Monday’s sharp drop to $1855.
  • 50-HMA challenges the recovery mode after the bearish crossover.
  •  Bullish RSI keeps the buyers hopeful in the near-term.

Gold (XAU/USD) witnessed good two-way businesses on Monday, as traders danced to the tune of the optimism on the agreement of a US stimulus deal in the first half of the day.

Meanwhile, in the latter part of the day, gold slumped nearly $50 from weekly tops of $1907 to $1855 levels on the narrative of a new covid strain found in the UK, which fuelled heavy risk aversion across the board and pumped the greenback against its major rivals.

Gold Price Chart: Hourly

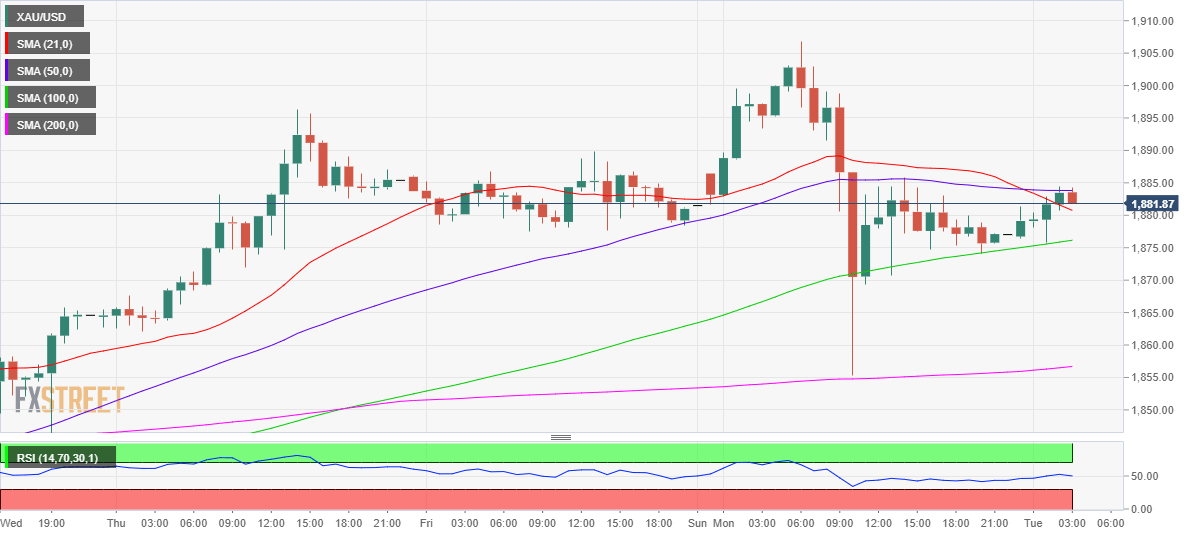
Looking at the hourly chart, gold is trying hard to extend the overnight recovery, facing stiff hurdle at the horizontal 50-hourly moving average (HMA) at $1884.

The bearish crossover spotted on the said timeframe is likely capping the upside attempts in the spot. The 21-HMA crossed the 50-HMA from above post-Tokyo open.

The immediate support is seen at the 21-HMA, now at $1880, below which the upward-sloping 100-HMA at $1876 could be tested. Further south, the critical 200-HMA at $1856 will be a tough nut to crack for the bears.

On the flip side, the Relative Strength Index (RSI) still holds above the midline, keeping the bias for a rebound intact.

Acceptance above the 50-HMA barrier could expose the $1900 level. The next resistance awaits at Monday’s high of $1907.

Gold Additional levels

XAU/USD

Overview
Today last price 1883.46
Today Daily Change 7.78
Today Daily Change % 0.41
Today daily open 1875.68
 
Trends
Daily SMA20 1837.29
Daily SMA50 1870.23
Daily SMA100 1904.33
Daily SMA200 1816.55
 
Levels
Previous Daily High 1906.87
Previous Daily Low 1855.28
Previous Weekly High 1896.3
Previous Weekly Low 1819.08
Previous Monthly High 1965.58
Previous Monthly Low 1764.6
Daily Fibonacci 38.2% 1874.99
Daily Fibonacci 61.8% 1887.16
Daily Pivot Point S1 1851.68
Daily Pivot Point S2 1827.69
Daily Pivot Point S3 1800.09
Daily Pivot Point R1 1903.27
Daily Pivot Point R2 1930.87
Daily Pivot Point R3 1954.86


Share: Feed news

Information on these pages contains forward-looking statements that involve risks and uncertainties. Markets and instruments profiled on this page are for informational purposes only and should not in any way come across as a recommendation to buy or sell in these assets. You should do your own thorough research before making any investment decisions. FXStreet does not in any way guarantee that this information is free from mistakes, errors, or material misstatements. It also does not guarantee that this information is of a timely nature. Investing in Open Markets involves a great deal of risk, including the loss of all or a portion of your investment, as well as emotional distress. All risks, losses and costs associated with investing, including total loss of principal, are your responsibility. The views and opinions expressed in this article are those of the authors and do not necessarily reflect the official policy or position of FXStreet nor its advertisers. The author will not be held responsible for information that is found at the end of links posted on this page.

If not otherwise explicitly mentioned in the body of the article, at the time of writing, the author has no position in any stock mentioned in this article and no business relationship with any company mentioned. The author has not received compensation for writing this article, other than from FXStreet.

FXStreet and the author do not provide personalized recommendations. The author makes no representations as to the accuracy, completeness, or suitability of this information. FXStreet and the author will not be liable for any errors, omissions or any losses, injuries or damages arising from this information and its display or use. Errors and omissions excepted.

The author and FXStreet are not registered investment advisors and nothing in this article is intended to be investment advice.

Recommended content


Recommended content

Editors’ Picks

EUR/USD drops to near 1.0850, further support at nine-day EMA

EUR/USD drops to near 1.0850, further support at nine-day EMA

EUR/USD continues to lose ground, trading around 1.0860 during the Asian hours on Friday. From a technical perspective on a daily chart analysis indicates a sideways trend for the pair as it continues to lie within the symmetrical triangle.

EUR/USD News

GBP/USD posts modest gains above 1.2650, focus on the Fedspeak

GBP/USD posts modest gains above 1.2650, focus on the Fedspeak

The GBP/USD pair posts modest gains near 1.2670 during the Asian session on Friday. Meanwhile, the USD Index recovers some lost ground after retracing to multi-week lows near 104.00 in the previous session.

GBP/USD News

Gold price gains ground, with Fed speakers in focus

Gold price gains ground, with Fed speakers in focus

The Gold price trades with a positive bias on Friday. The bullish move of precious metals in the previous sessions was bolstered by the softer-than-expected US inflation data in April, which triggered hope for rate cuts from the US Fed. 

Gold News

LINK price jumps 10% as Chainlink races toward tokenization of funds

LINK price jumps 10% as Chainlink races toward tokenization of funds

Chainlink price has remained range-bound for a while, stuck between the $16.00 roadblock to the upside and $13.08 to the downside. However, in light of recent revelations, the token may have further upside potential.

Read more

Fed speak tempers rate cut expectations

Fed speak tempers rate cut expectations

The biggest takeaway into Friday is the latest round of Fed speak. These Fed officials reiterated their stance rates should be kept restrictive for a longer period of time until there is more clear evidence inflation is heading back towards the 2% target.  

Read more

Forex MAJORS

Cryptocurrencies

Signatures