Gold Price Analysis: Tests monthly resistance trendline above $1,600
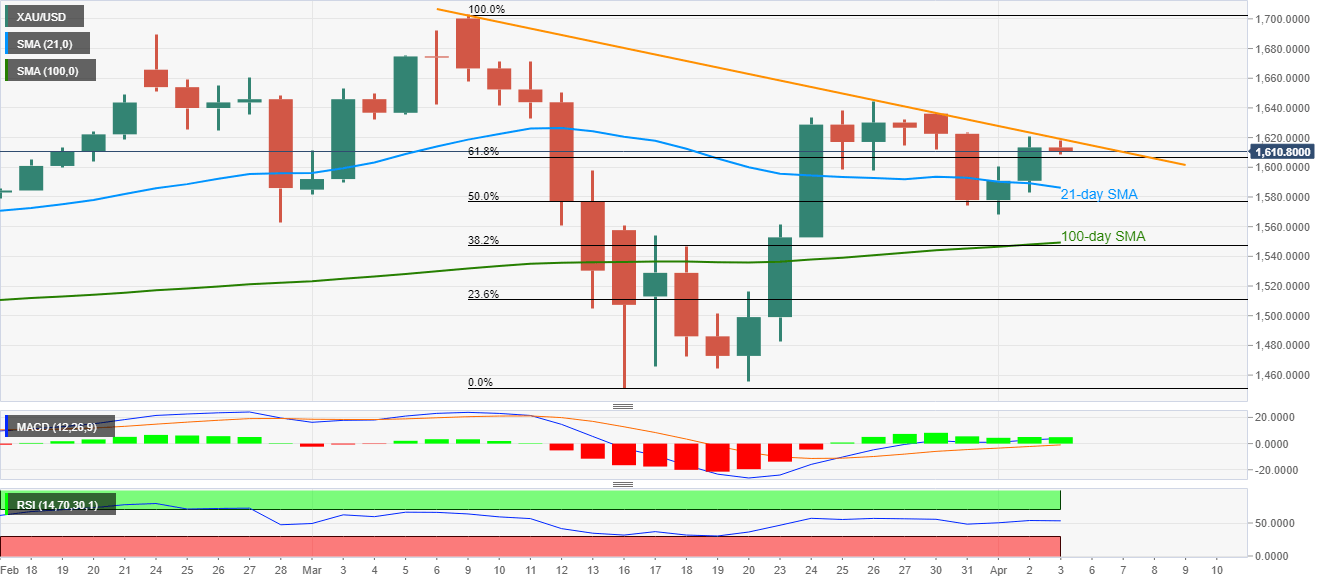
- Gold struggles between 61.8% Fibonacci retracement and near-term key resistance line.
- Bullish MACD, sustained trading beyond key supports keep buyers hopeful.
- 100-day SMA, 38.2% retracement will keep sellers away.

Gold trades with mild losses near three-day highs, currently down 0.07% around $1,612 while heading into the European session on Friday.
Although repeated failures to take out the monthly trend line portrays the underlying weakness in momentum, bullish MACD and sustained trading beyond 61.8% Fibonacci retracement of March month downside keep buyers hopeful.
As a result, a daily closing beyond $1,620 will push prices upwards to a one-week high surrounding $1,645 ahead of targeting $1,680 and $1,700.
On the contrary, the bullion’s break below 61.8% Fibonacci retracement level of $1,616 can recall 21-day SMA, currently near $1,586.
However, a confluence of 100-day SMA and 38.2% Fibonacci retracement near $,1550/47 will question the bears afterward.
Gold daily chart
Trend: Bullish
Author

Anil Panchal
FXStreet
Anil Panchal has nearly 15 years of experience in tracking financial markets. With a keen interest in macroeconomics, Anil aptly tracks global news/updates and stays well-informed about the global financial moves and their implications.


