|

General Electric (GE Stock) longs are risk free

We're going to look at the past performance of Elliott Wave Charts of General Electric stock ticker symbol: $GE, which we presented to members at the elliottwave-forecast. In which, the rally from 13 May 2020 low unfolded in 3 wave structure with extended 3rd wave. Therefore, we knew that the structure is taking a form of an impulse sequence & it should see another new high to complete the 5 waves rally. So, we advised members not to sell it & buy the dips in 3, 7, or 11 swings at the blue box areas. We will explain the structure & forecast below:

General Electric Elliott Wave chart

GE

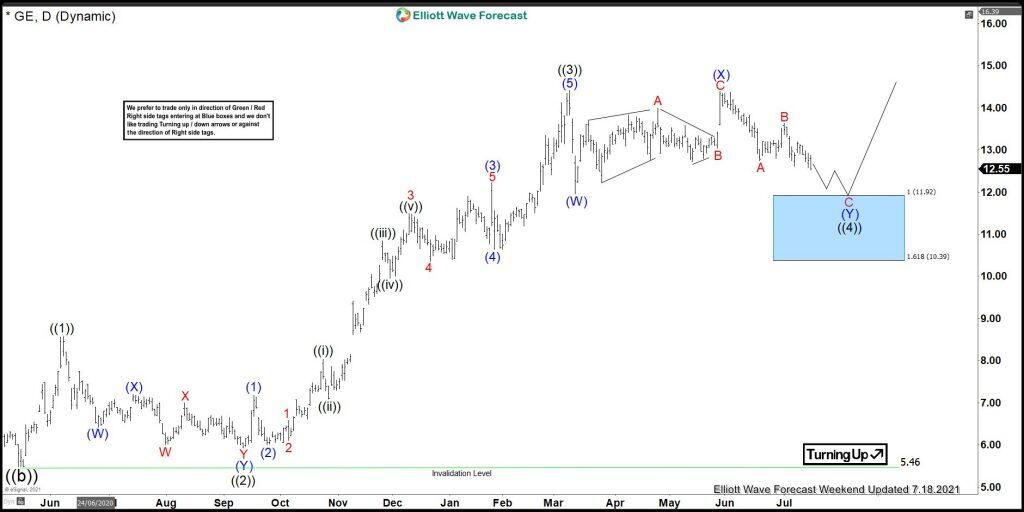
Here’s Daily Elliott wave Chart from the 7/18/2021 weekend update. In which, the stock is showing an impulse rally higher from 5.13.2020 low where wave ((1)) ended at $8.57 high. Wave ((2)) ended at $5.93 low, wave ((3)) ended at $14.42 high and made a pullback in wave ((4)). The internals of that pullback unfolded as Elliott wave double three structure where wave (W) ended at $11.95 low. Wave (X) ended at $14.40 high and wave (Y) was expected to reach $11.92- $10.39 blue box area from where reaction higher was expected to take place.

General Electric Elliott Wave chart

Chart

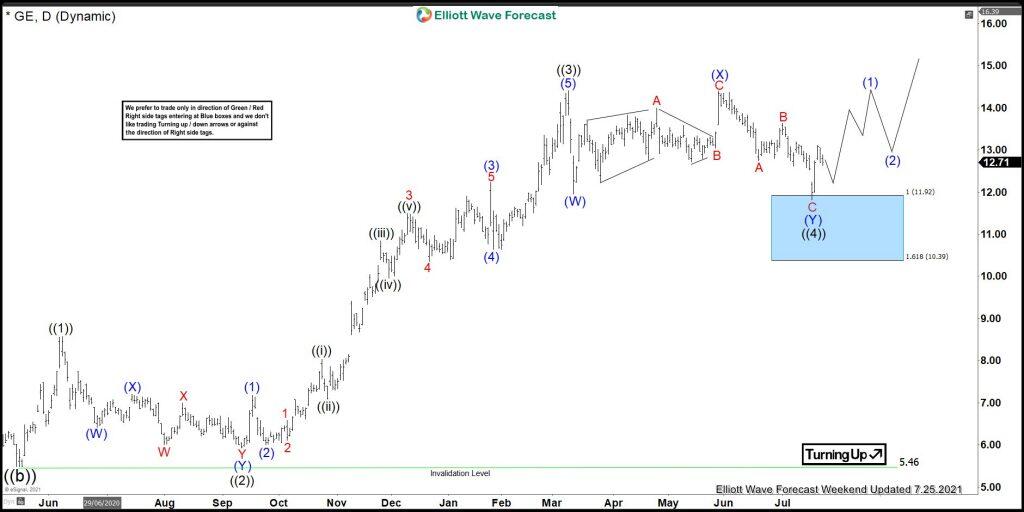
Here’s the Daily Elliott wave Chart from the 7/25/2021 update. In which the stock is showing a reaction higher from the blue box area. Right after ending the double three correction within the blue box area. Allowed members to create a risk-free position shortly after taking the long positions at the blue box area. However, a break above $14.42 high is still needed to confirm the next extension higher & avoid double correction lower.

Premium

You have reached your limit of 3 free articles for this month.

Start your subscription and get access to all our original articles.

Subscribe to PremiumSign In

Author

Elliott Wave Forecast Team

Elliott Wave Forecast Team

ElliottWave-Forecast.com

More from Elliott Wave Forecast Team
Share:

Markets move fast. We move first.

Orange Juice Newsletter brings you expert driven insights - not headlines. Every day on your inbox.

By subscribing you agree to our Terms and conditions.

Editor's Picks

EUR/USD climbs toward 1.1800 on broad USD weakness

EUR/USD gathers bullish momentum and advances toward 1.1800 in the second half of the day on Tuesday. The US Dollar weakens and helps the pair stretch higher after the employment report showed that Nonfarm Payrolls declined by 105,000 in October before rising by 64,000 in November.

GBP/USD climbs to fresh two-month high above 1.3400

GBP/USD gains traction in the American session and trades at its highest level since mid-October above 1.3430. The British Pound benefits from upbeat PMI data, while the US Dollar struggles to find demand following the mixed employment figures and weaker-than-forecast PMI prints, allowing the pair to march north.

Gold extends its consolidative phase around $4,300

Gold trades in positive above $4,300 after spending the first half of the day under bearish pressure. XAU/USD capitalizes on renewed USD weakness after the jobs report showed that the Unemployment Rate climbed to 4.6% in November and the PMI data revealed a loss of growth momentum in the private sector in December. 

US Retail Sales virtually unchanged at $732.6 billion in October

Retail Sales in the United States were virtually unchanged at $732.6 billion in October, the US Census Bureau reported on Tuesday. This print followed the 0.1% increase (revised from 0.3%) recorded in September and came in below the market expectation of +0.1%.

Ukraine-Russia in the spotlight once again

Since the start of the week, gold’s price has moved lower, but has yet to erase the gains made last week. In today’s report we intend to focus on the newest round of peace talks between Russia and Ukraine, whilst noting the release of the US Employment data later on day and end our report with an update in regards to the tensions brewing in Venezuela.

BNB Price Forecast: BNB slips below $855 as bearish on-chain signals and momentum indicators turn negative

BNB, formerly known as Binance Coin, continues to trade down around $855 at the time of writing on Tuesday, after a slight decline the previous day. Bearish sentiment further strengthens as BNB’s on-chain and derivatives data show rising retail activity.