|

GBP/USD turns negative, with bears eyeing 1.2000 below the 100-DMA

  • GBP/USD tests the 100-day Exponential Moving Average at 1.2033.
  • Traders are focused on growth figures from the UK, Fed Chair Powell’s speech at Congress, and US NFP figures.
  • GBP/USD Price Analysis: Consolidated, waiting for a fresh catalyst to get direction.

GBP/USD trims some of last Friday’s gains despite an upbeat sentiment led by Wall Street, opening in the green. A light calendar in the United Kingdom (UK) would keep traders focused on the busiest docket in the United States (US). At the time of writing, the GBP/USD is trading at 1.2019.

The GBP/USD at the mercy of US economic data

As abovementioned, risk sentiment is a mixed bag. The UK economic calendar will reveal the Gross Domestic Product (GDP) on Friday, ahead of the Bank of England’s (BoE) March 23 meeting. The US economic docket will feature Factory Orders for January, foreseen to fall to -1.8%, below the prior’s month reading of 1.8%.

The greenback (USD) is printing losses, capping the GBP/USD’s fall below the 1.2000 figure. The US Dollar Index (DXY), a gauge of the buck’s value vs. a basket of six currencies, extended its losses, by 0.14%, at 104.380. Meanwhile, US Treasury bond yields, which underpinned the USD last week’s price action, are down, with the 10-year benchmark note rate below 4%, at 3.950%.

The week could be volatile due to US Federal Reserve (Fed) Chairman Jerome Powell’s appearance at the US Congress on March 7 and 8. Analysts expect Powell to maintain a hawkish stance, echoing some of his colleague’s tone. He’s expected to reiterate that interest rates must go higher for longer if the US economy continues to print solid data.

Following astonishing January data, the US Nonfarm Payrolls figures are awaited on Friday. Market participants estimate the US economy added 200K jobs to the economy. Any figures below expectations would weigh on the USD, meaning the GBP/USD could appreciate. On the flip side, stronger data would warrant further tightening by the Fed.

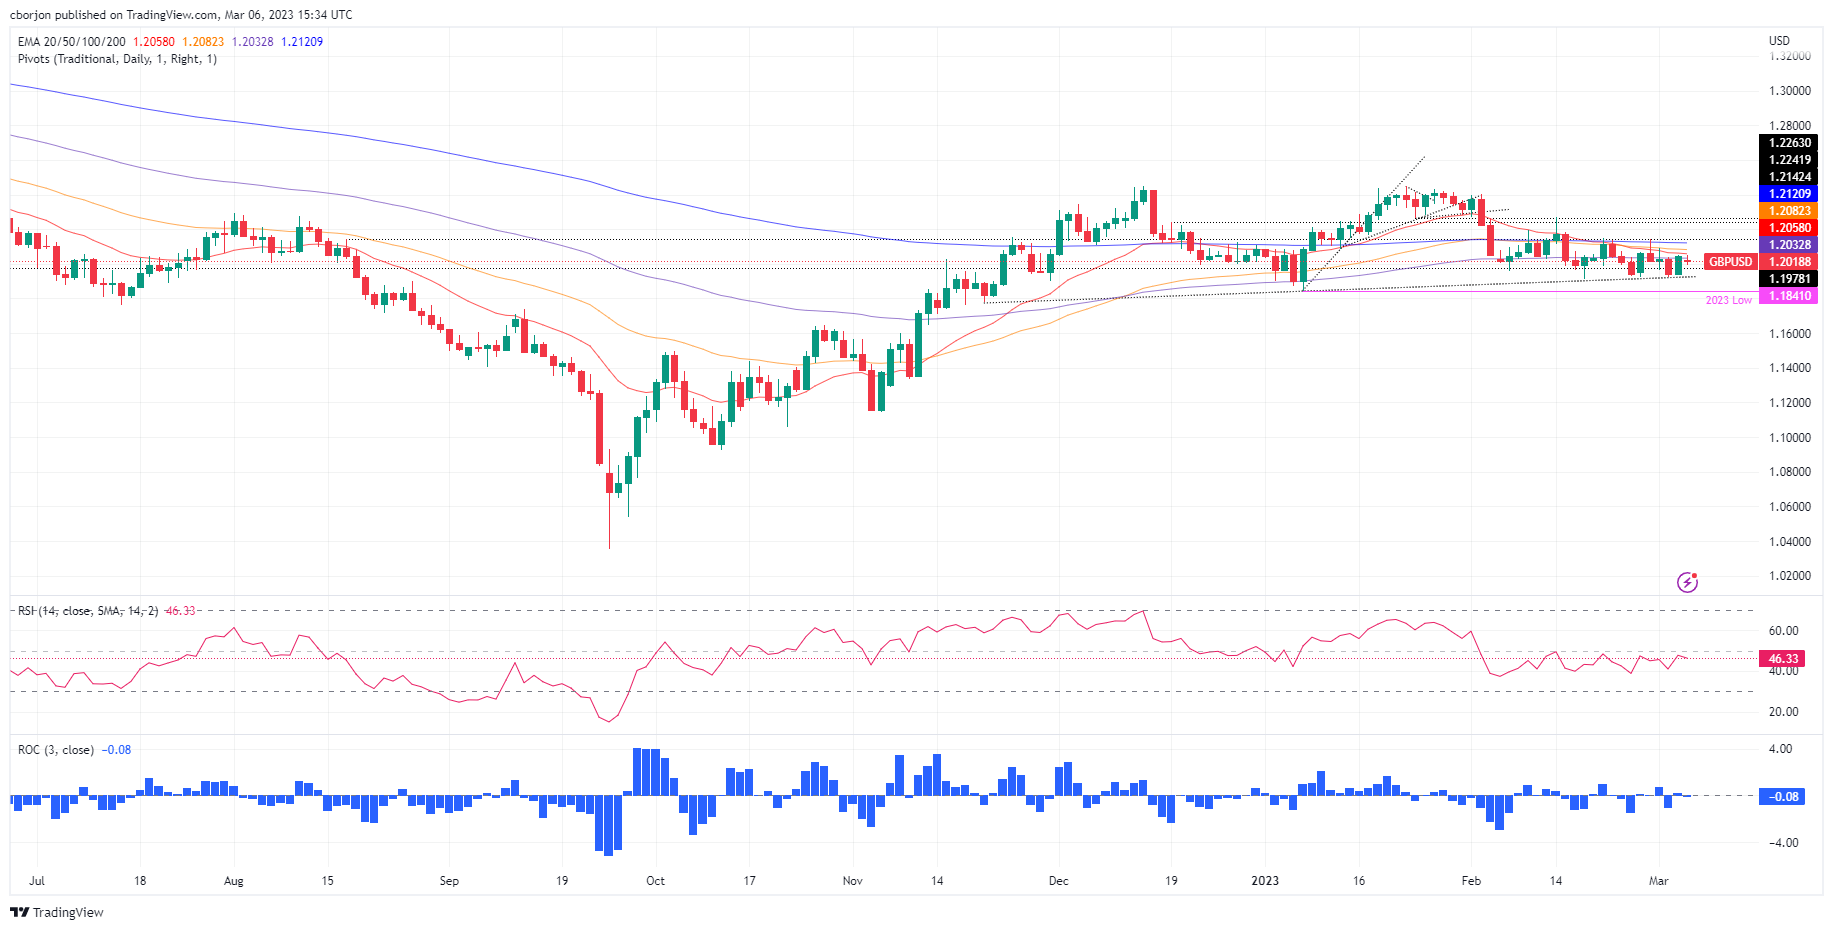
GBP/USD Technical levels

The GBP/USD daily chart suggests that the pair is bottoming around 1.2000. The Relative Strength Index (RSI) is in bearish territory, with a downward slope, meaning that sellers are in control. The Rate of Change (RoC) suggests the sellers are losing momentum. Therefore mixed signals within oscillators suggest the GBP/USD pair is sideways. For a bullish continuation, the GBP/USD must clear the 200-day EMA at 1.2120. On the bearish front, the GBP/USD must break below the 100-day EMA at 1.2033 and beneath 1.2000 to pave the way for further losses.

GBP/USD

Overview
Today last price1.2021
Today Daily Change-0.0024
Today Daily Change %-0.20
Today daily open1.2045
 
Trends
Daily SMA201.2047
Daily SMA501.2141
Daily SMA1001.1985
Daily SMA2001.1916
 
Levels
Previous Daily High1.2049
Previous Daily Low1.1943
Previous Weekly High1.2143
Previous Weekly Low1.1922
Previous Monthly High1.2402
Previous Monthly Low1.1915
Daily Fibonacci 38.2%1.2008
Daily Fibonacci 61.8%1.1983
Daily Pivot Point S11.1975
Daily Pivot Point S21.1906
Daily Pivot Point S31.1869
Daily Pivot Point R11.2081
Daily Pivot Point R21.2118
Daily Pivot Point R31.2188

Author

Christian Borjon Valencia

Markets analyst, news editor, and trading instructor with over 14 years of experience across FX, commodities, US equity indices, and global macro markets.

More from Christian Borjon Valencia
Share:

Editor's Picks

GBP/USD trades with caution above 1.3200 amid UK political chaos

GBP/USD regains the 1.3200 level in early Europe on Monday, failing to fill up the bearish opening gap. UK PM Keir Starmer is set to announce his exit plan later today. That continues to undermine the British Pound amid renewed haven demand for the US Dollar.

EUR/USD struggles above 1.1450 amid concerns over Iran deal progress

EUR/USD stays defensive above 1.1450 in the European trading hours on Monday. Concerns about progress for the US-Iran peace deal and expectations of higher US interest rates keep the US Dollar supported against the Euro. ECB President Lagarde is set to speak later on Monday.  

Gold sticks to modest gains; bulls seem hesitant amid Fed hike bets, Iran risks

Gold attracts some buyers at the start of a new week, and seems to have snapped a three-day losing streak to a more than one-week low, touched last Friday. Crude Oil prices turn lower following a modest bullish gap after mediators Qatar and Pakistan announced a formal 60-day roadmap aimed at securing a final US-Iran peace deal. This helps ease concerns around inflation and higher interest rates, offering some support to the precious metal.

Breaking: Iran closes the Strait of Hormuz amid ceasefire deal violation
Iran says it is closing the Strait of Hormuz after accusing the United States (US) and Israel of violating the ceasefire. According to Iran, the decision came over the continued Israeli strikes in Lebanon. The Iranian Revolutionary Guard Corps Navy issued a warning to all vessels: "Do not approach the Strait of Hormuz; otherwise, your security will be jeopardized."
Cardano: Whale accumulation offers limited relief

Cardano (ADA) is trading near $0.158 on Monday after a steep 14% correction in the previous week. While on-chain data from Santiment indicates that some large holders accumulated ADA during the recent sell-off, derivatives market indicators remain mixed.

Regime change: Inside Kevin Warsh's first move to make the Fed unreadable on purpose

The rate did not move. That was the least interesting thing about Kevin Warsh's first meeting in charge of the Fed. The FOMC held its benchmark at 3.50%-3.75% for the fourth straight meeting, exactly as priced, and then the new chair used his first press conference to dismantle the machinery the market has leaned on for a decade.