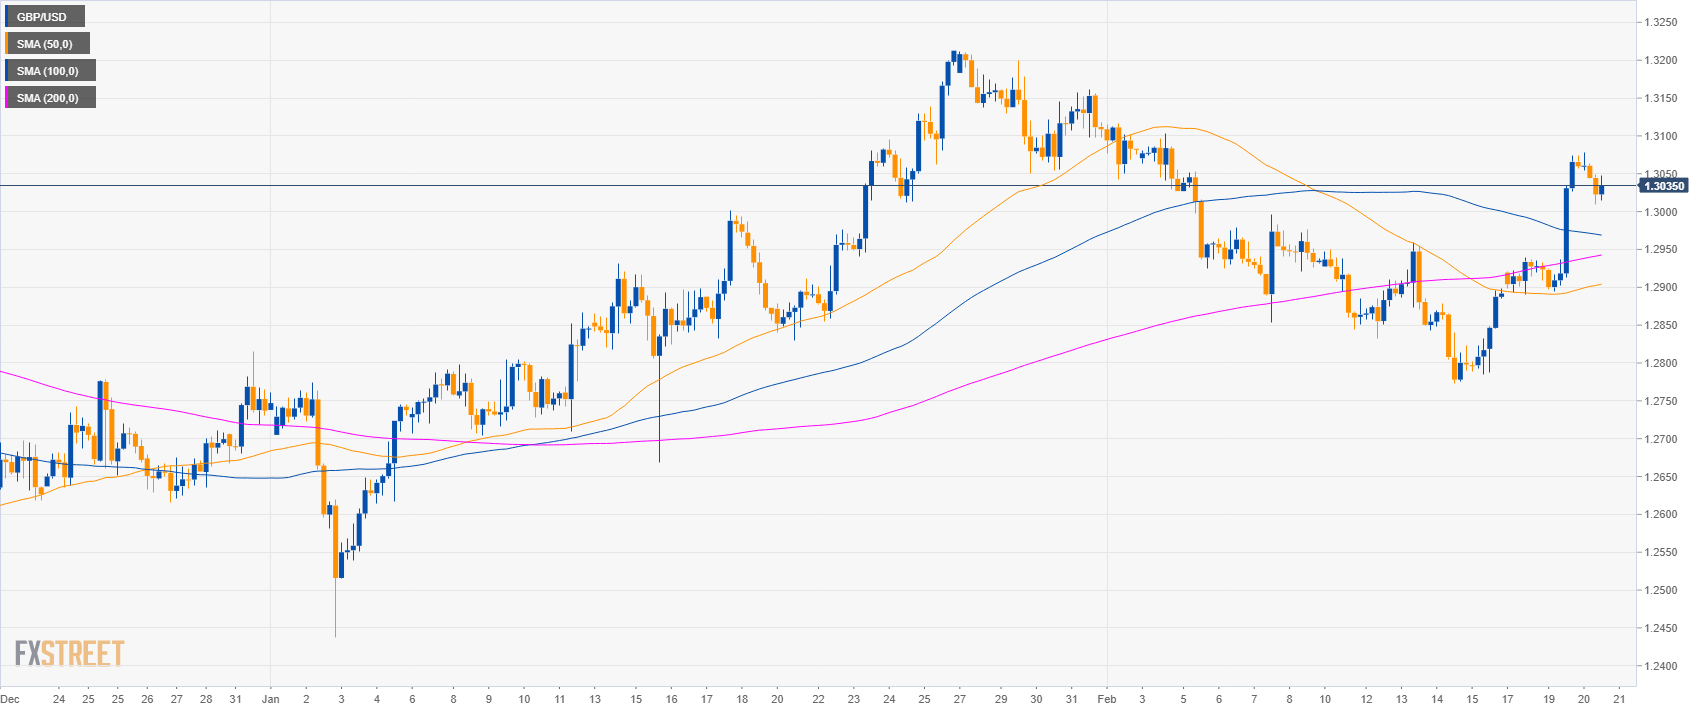
GBP/USD daily chart
- GBP/USD bulls have reclaimed the 200-day simple moving average (SMA).
- Investors are awaiting the release of the FOMC Minutes at 19.00 GMT. The news can potentially provide high volatility in the financial markets and in USD-related pairs.

GBP/USD 4-hour chart
- GBP/USD bulls broke above the main SMAs suggesting a bullish bias in the medium-term.
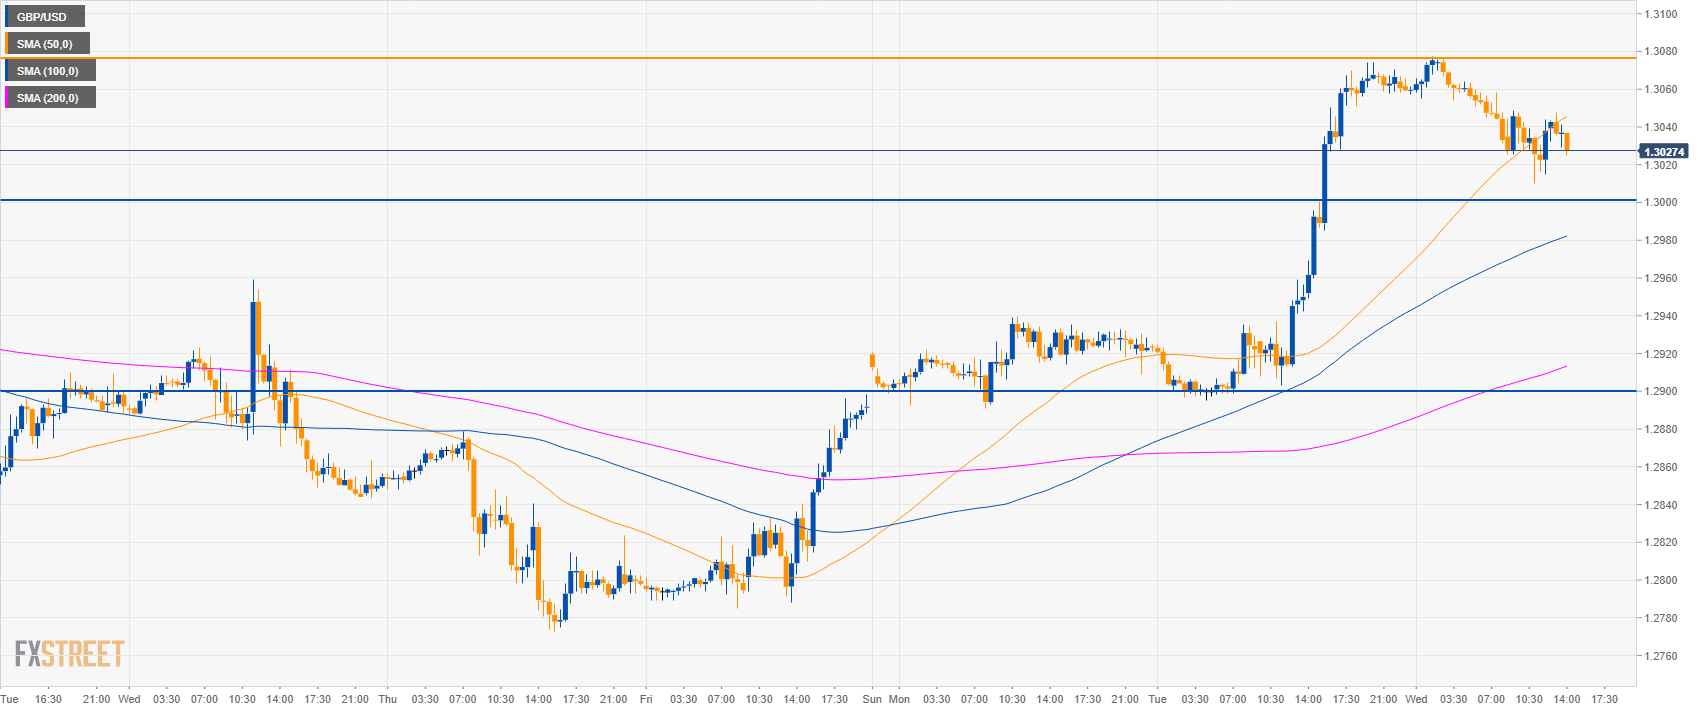
GBP/USD 30-minute chart
- GBP/USD is trading above the main SMAs suggesting a bullish momentum in the short-term.
- The level to beat for bulls is 1.3080. The next target to the upside is seen at 1.3125 and 1.3185 level.
- Support is at 1.3000 and 1.2960 level.
Additional key levels
GBP/USD
Overview:
Today Last Price: 1.3034
Today Daily change: -33 pips
Today Daily change %: -0.25%
Today Daily Open: 1.3067
Trends:
Daily SMA20: 1.2999
Daily SMA50: 1.2843
Daily SMA100: 1.2878
Daily SMA200: 1.3002
Levels:
Previous Daily High: 1.3074
Previous Daily Low: 1.2895
Previous Weekly High: 1.2959
Previous Weekly Low: 1.2773
Previous Monthly High: 1.3214
Previous Monthly Low: 1.2438
Daily Fibonacci 38.2%: 1.3006
Daily Fibonacci 61.8%: 1.2963
Daily Pivot Point S1: 1.295
Daily Pivot Point S2: 1.2833
Daily Pivot Point S3: 1.2771
Daily Pivot Point R1: 1.3129
Daily Pivot Point R2: 1.3191
Daily Pivot Point R3: 1.3308
Note: All information on this page is subject to change. The use of this website constitutes acceptance of our user agreement. Please read our privacy policy and legal disclaimer. Opinions expressed at FXstreet.com are those of the individual authors and do not necessarily represent the opinion of FXstreet.com or its management. Risk Disclosure: Trading foreign exchange on margin carries a high level of risk, and may not be suitable for all investors. The high degree of leverage can work against you as well as for you. Before deciding to invest in foreign exchange you should carefully consider your investment objectives, level of experience, and risk appetite. The possibility exists that you could sustain a loss of some or all of your initial investment and therefore you should not invest money that you cannot afford to lose. You should be aware of all the risks associated with foreign exchange trading, and seek advice from an independent financial advisor if you have any doubts.
Recommended content
Editors’ Picks
EUR/USD holds above 1.0700 ahead of key US data

EUR/USD trades in a tight range above 1.0700 in the early European session on Friday. The US Dollar struggles to gather strength ahead of key PCE Price Index data, the Fed's preferred gauge of inflation, and helps the pair hold its ground.
USD/JPY stays above 156.00 after BoJ Governor Ueda's comments

USD/JPY holds above 156.00 after surging above this level with the initial reaction to the Bank of Japan's decision to leave the policy settings unchanged. BoJ Governor said weak Yen was not impacting prices but added that they will watch FX developments closely.
Gold price oscillates in a range as the focus remains glued to the US PCE Price Index

Gold price struggles to attract any meaningful buyers amid the emergence of fresh USD buying. Bets that the Fed will keep rates higher for longer amid sticky inflation help revive the USD demand.
Bitcoin Weekly Forecast: BTC’s next breakout could propel it to $80,000 Premium

Bitcoin’s recent price consolidation could be nearing its end as technical indicators and on-chain metrics suggest a potential upward breakout. However, this move would not be straightforward and could punish impatient investors.
US core PCE inflation set to signal firm price pressures as markets delay Federal Reserve rate cut bets

The core PCE Price Index, which excludes volatile food and energy prices, is seen as the more influential measure of inflation in terms of Fed positioning. The index is forecast to rise 0.3% on a monthly basis in March, matching February’s increase.