- GBP/USD broke below the previous low established in May at 1.2558.
- The next support in line is seen at 1.2484 according to the Technical Confluences Indicator.
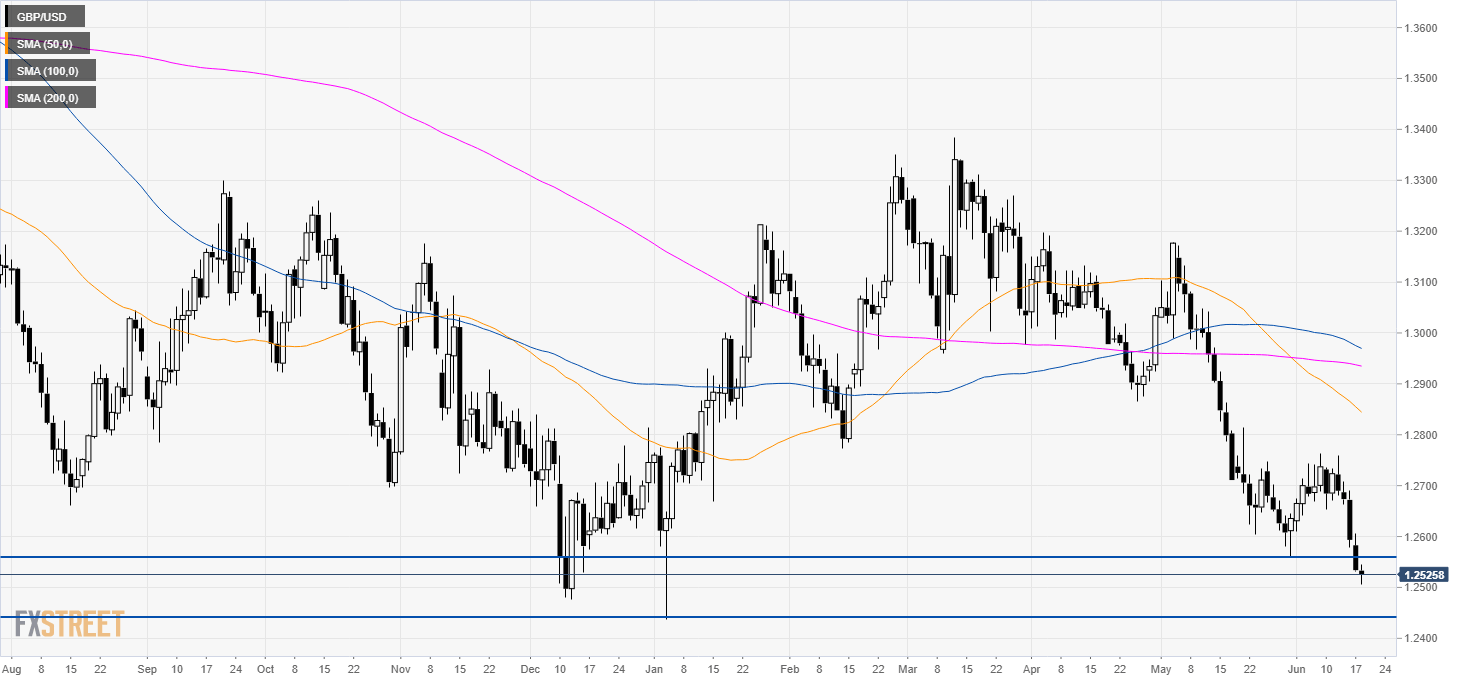
GBP/USD daily chart
GBP/USD is trading in a bear trend below its main simple moving averages. The market broke below the May’s low at 1.2558. The next main support to look at is seen at 1.2438, June 3 low.
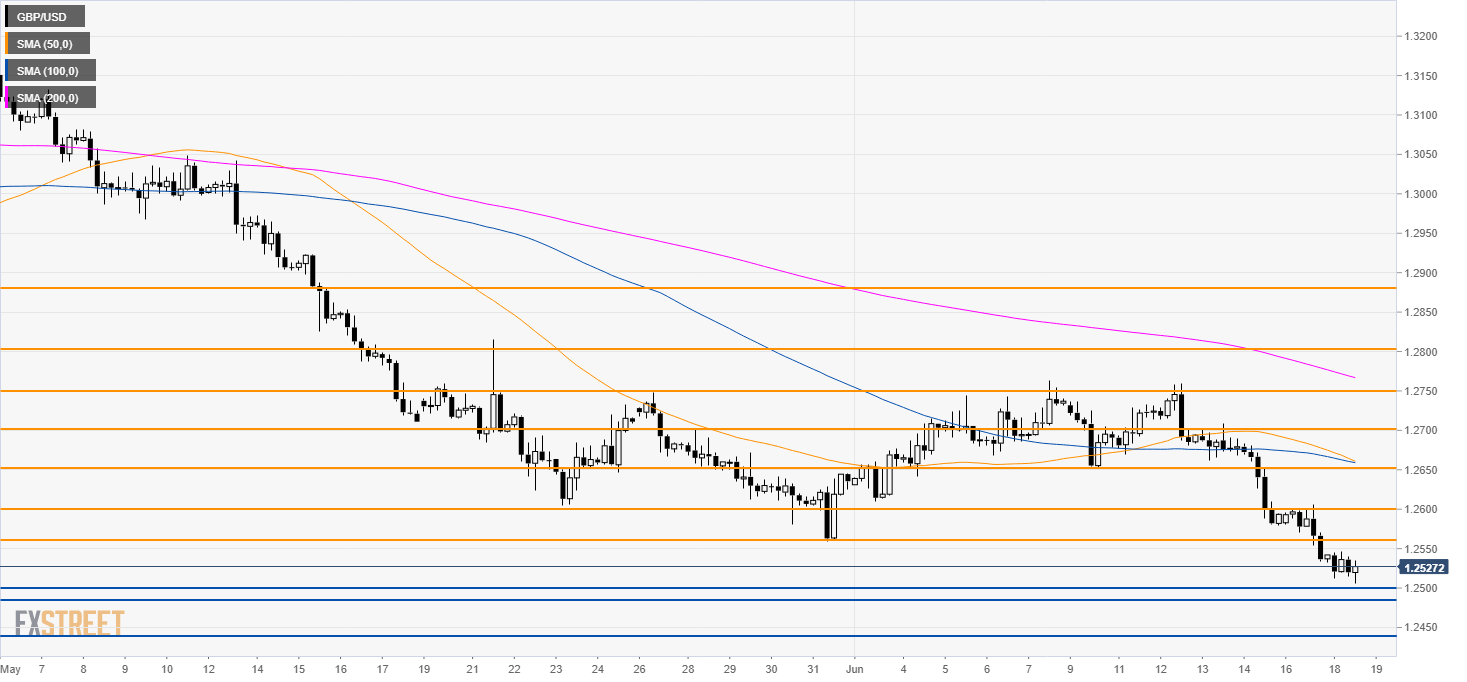
The market is under bearish pressure below 1.2560 and the main simple moving averages (SMAs). The level to beat for bears is the 1.2500 support followed by 1.2484 which is the confluence of the Pivot Point one-day Support 2 and the previous yearly low.
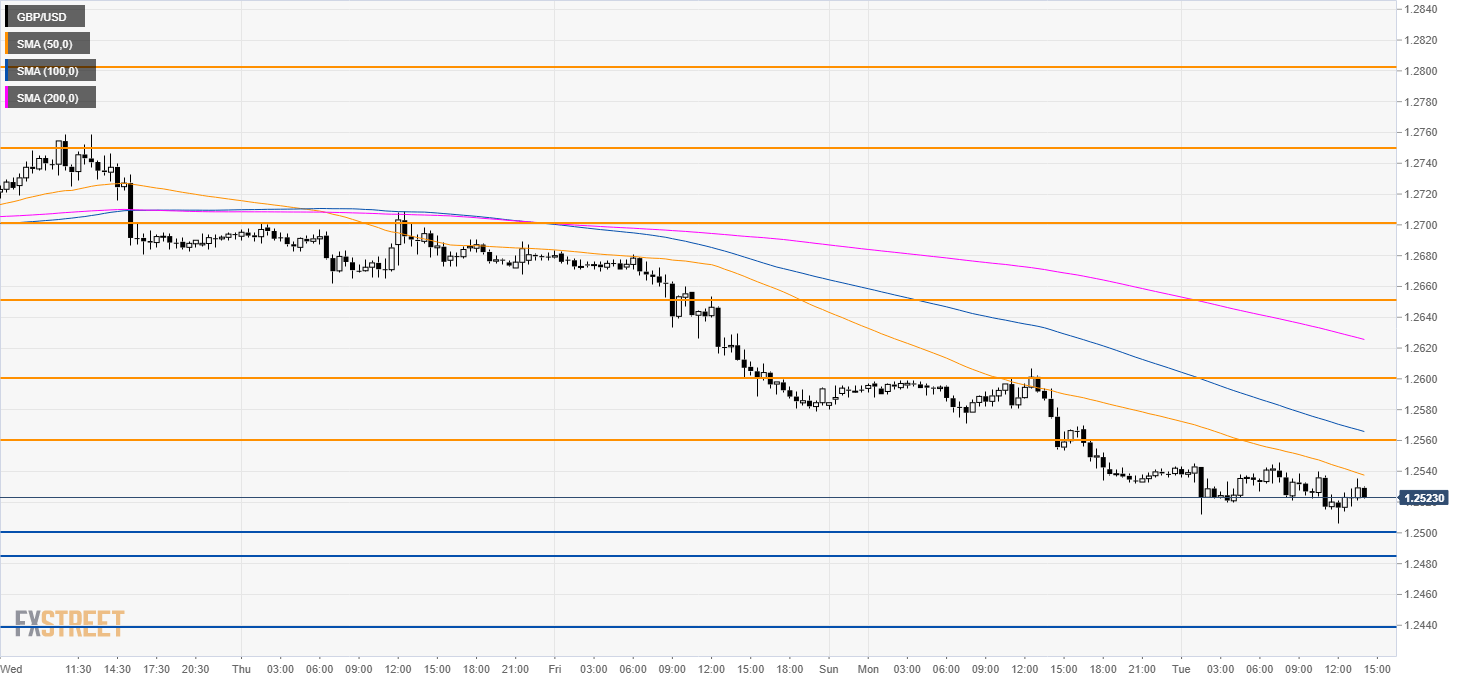
GBP/USD 30-minute chart
GBP/USD is trading below its main SMAs suggesting a bearish bias in the short term. The 1.2588 is seen as strong resistance according to the Technical Confluences Indicator.
Note: All information on this page is subject to change. The use of this website constitutes acceptance of our user agreement. Please read our privacy policy and legal disclaimer. Opinions expressed at FXstreet.com are those of the individual authors and do not necessarily represent the opinion of FXstreet.com or its management. Risk Disclosure: Trading foreign exchange on margin carries a high level of risk, and may not be suitable for all investors. The high degree of leverage can work against you as well as for you. Before deciding to invest in foreign exchange you should carefully consider your investment objectives, level of experience, and risk appetite. The possibility exists that you could sustain a loss of some or all of your initial investment and therefore you should not invest money that you cannot afford to lose. You should be aware of all the risks associated with foreign exchange trading, and seek advice from an independent financial advisor if you have any doubts.
Recommended content
Editors’ Picks
EUR/USD trades with negative bias, holds above 1.0700 as traders await US PCE Price Index
EUR/USD edges lower during the Asian session on Friday and moves away from a two-week high, around the 1.0740 area touched the previous day. Spot prices trade around the 1.0725-1.0720 region and remain at the mercy of the US Dollar price dynamics ahead of the crucial US data.
USD/JPY jumps above 156.00 on BoJ's steady policy
USD/JPY has come under intense buying pressure, surging past 156.00 after the Bank of Japan kept the key rate unchanged but tweaked its policy statement. The BoJ maintained its fiscal year 2024 and 2025 core inflation forecasts, disappointing the Japanese Yen buyers.
Gold price flatlines as traders look to US PCE Price Index for some meaningful impetus
Gold price lacks any firm intraday direction and is influenced by a combination of diverging forces. The weaker US GDP print and a rise in US inflation benefit the metal amid subdued USD demand. Hawkish Fed expectations cap the upside as traders await the release of the US PCE Price Index.
Sei Price Prediction: SEI is in the zone of interest after a 10% leap
Sei price has been in recovery mode for almost ten days now, following a fall of almost 65% beginning in mid-March. While the SEI bulls continue to show strength, the uptrend could prove premature as massive bearish sentiment hovers above the altcoin’s price.
US economy: Slower growth with stronger inflation
The US Dollar strengthened, and stocks fell after statistical data from the US. The focus was on the preliminary estimate of GDP for the first quarter. Annualised quarterly growth came in at just 1.6%, down from the 2.5% and 3.4% previously forecast.