|

GBP/USD technical analysis: Cable pairing intraday losses below 1.2700 ahead of FOMC Minutes

  • The FOMC Minutes will be released at 18:00 GMT this Wednesday. No fireworks are expected according to analysts, however, volatility can always be around the corner on such news events.
  • GBP/USD is erasing its intraday losses however buyers would need to bring the currency pair above 1.2800 to create any meaningful recovery.
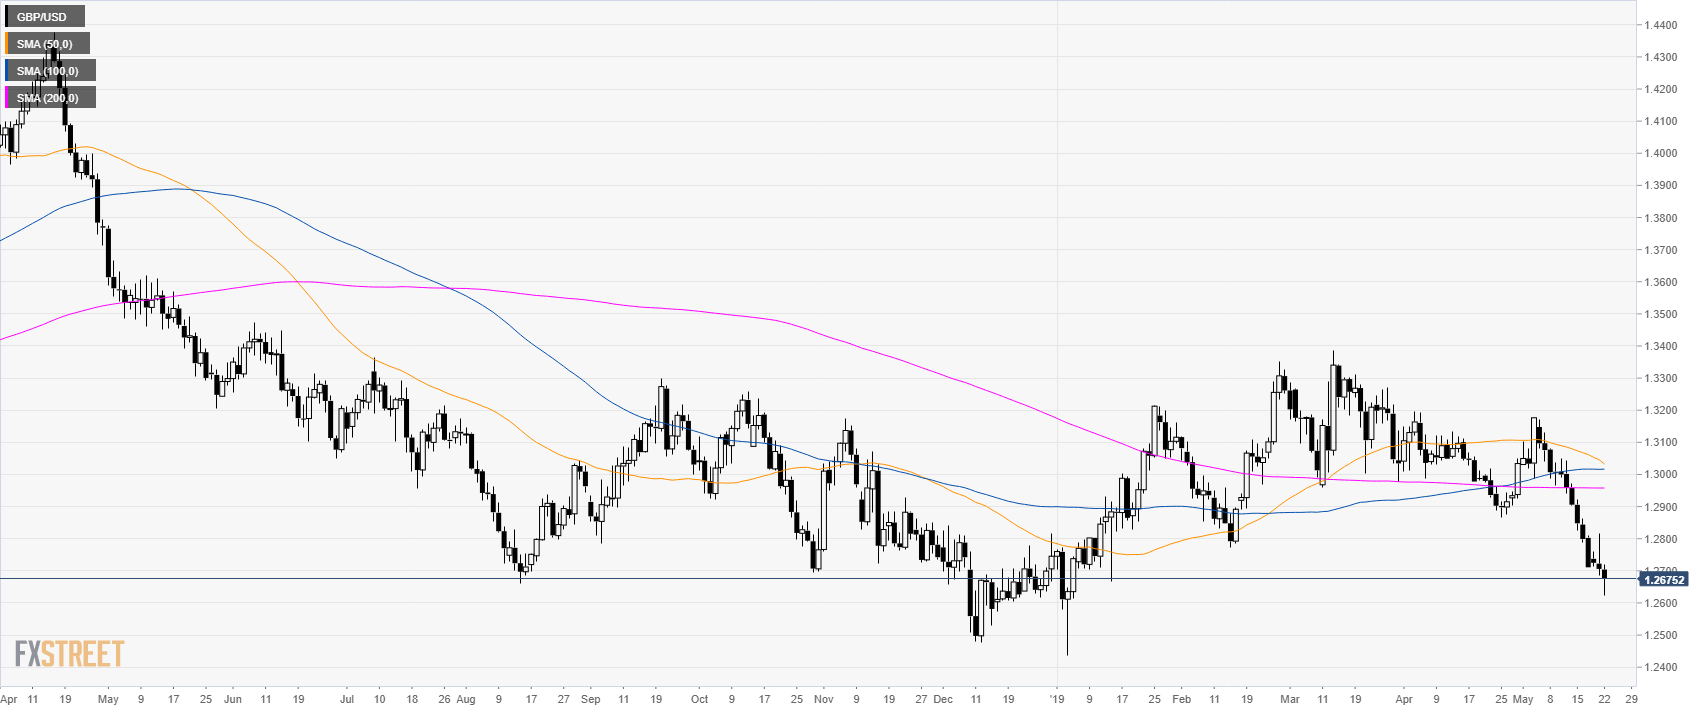
GBP/USD daily chart

GBP/USD has been under strong selling pressure in the last weeks. 


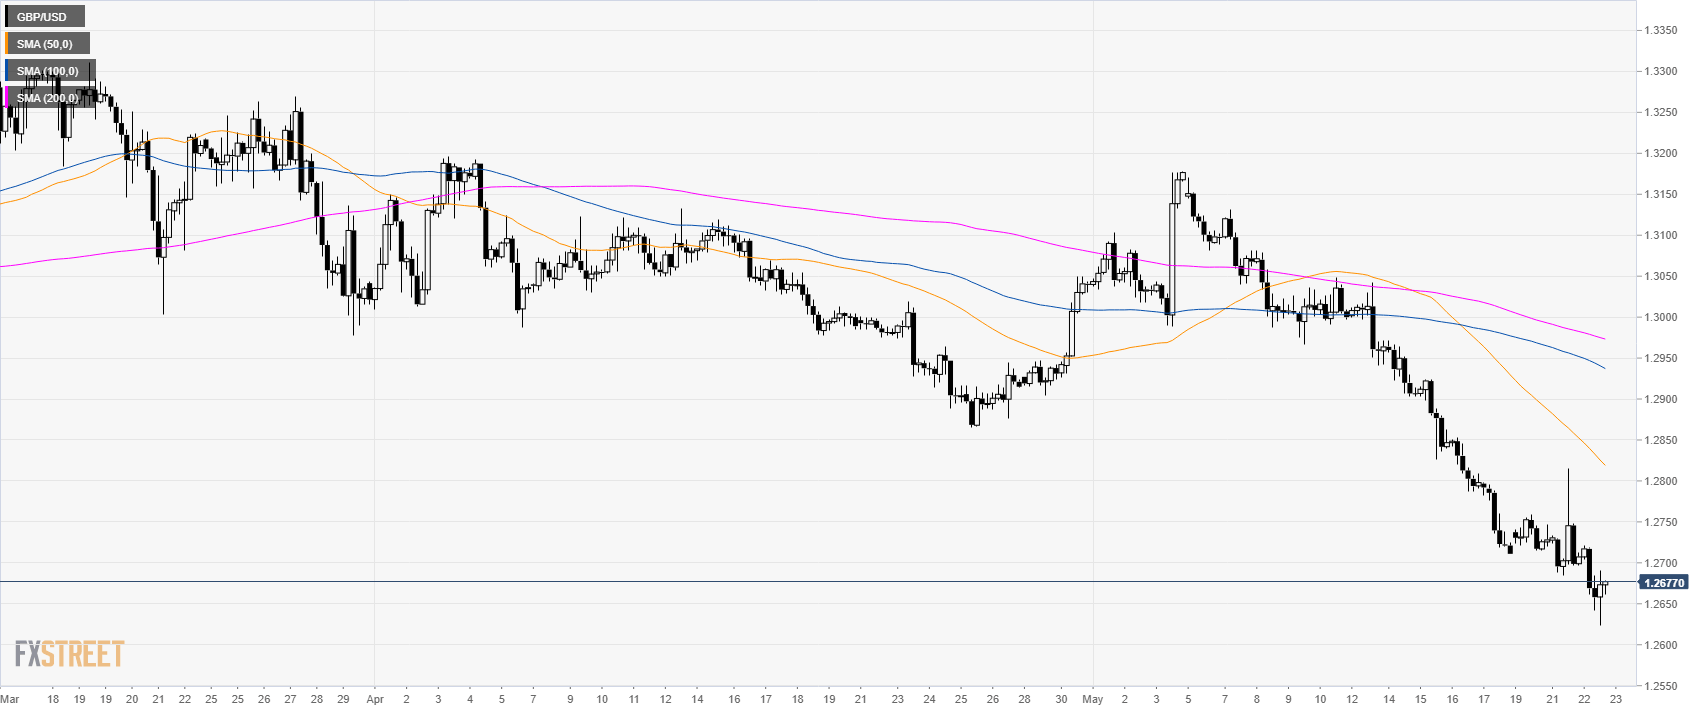
GBP/USD 4-hour chart

GBP/USD is trading below its main simple moving averages suggesting bearish momentum in the near term. 


GBP/USD 30-minute chart

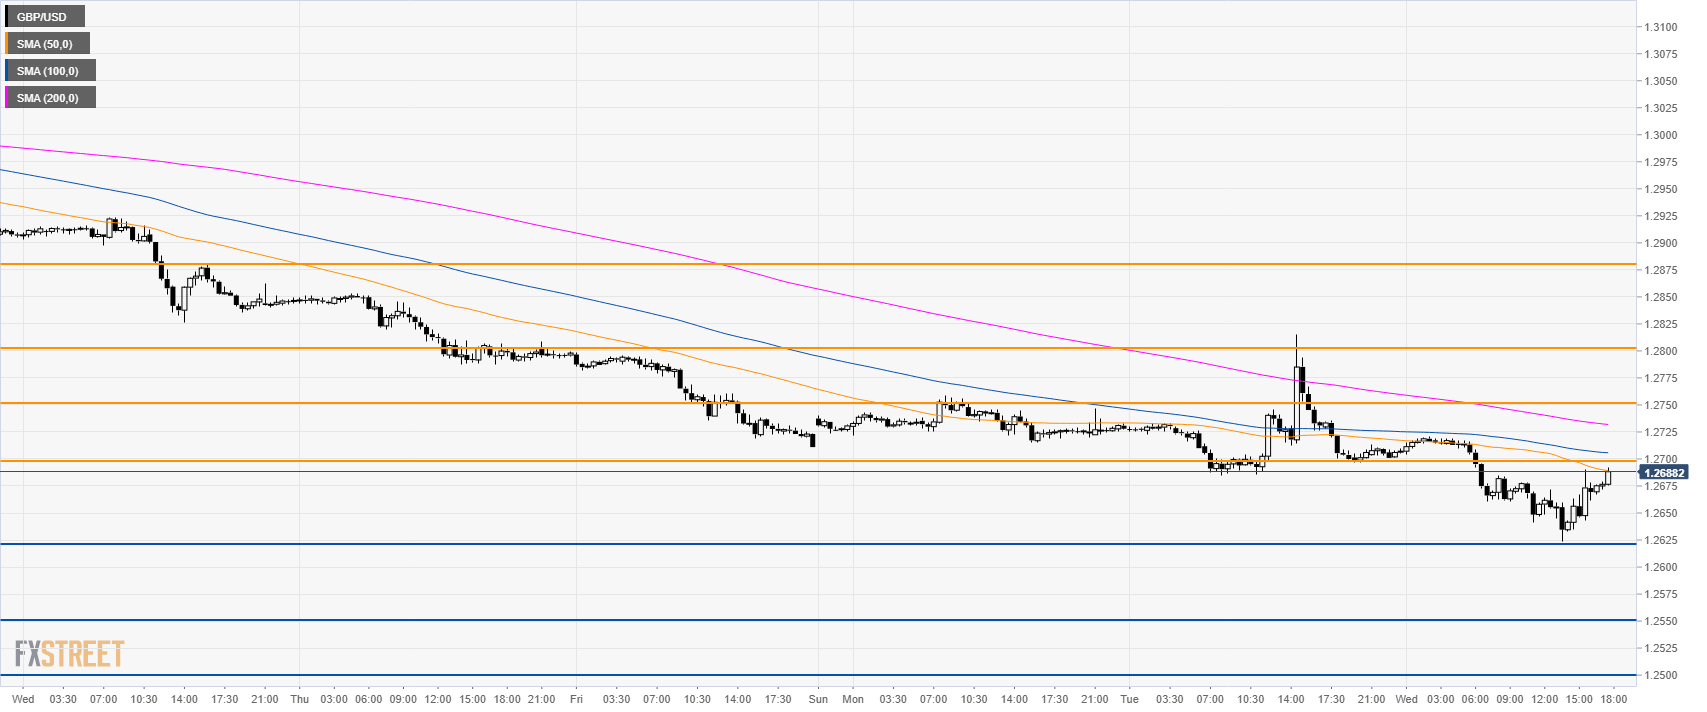
GBP/USD is trading below its main SMAs suggesting a bearish bias in the short term. If sellers overcome the 1.2625 support they could continue the downtrend towards 1.2550 and 1.2500 the figure. On the flip side, if the market breaks the 1.2700 figure a move up towards 1.2750 can be on the cards. Further up, resistances are seen at 1.2800 and 1.2875 levels. 

Additional key levels

GBP/USD

Overview
Today last price1.2677
Today Daily Change-0.0029
Today Daily Change %-0.23
Today daily open1.2706
 
Trends
Daily SMA201.2939
Daily SMA501.3046
Daily SMA1001.3016
Daily SMA2001.2958
Levels
Previous Daily High1.2815
Previous Daily Low1.2685
Previous Weekly High1.3042
Previous Weekly Low1.2711
Previous Monthly High1.3196
Previous Monthly Low1.2865
Daily Fibonacci 38.2%1.2735
Daily Fibonacci 61.8%1.2765
Daily Pivot Point S11.2656
Daily Pivot Point S21.2605
Daily Pivot Point S31.2526
Daily Pivot Point R11.2786
Daily Pivot Point R21.2865
Daily Pivot Point R31.2916

Author

Flavio Tosti

Flavio Tosti

Independent Analyst


More from Flavio Tosti
Share:

Editor's Picks

EUR/USD remains offered below 1.1600, seems vulnerable near multi-month low

The EUR/USD pair struggles to capitalize on the overnight bounce from the 1.1530 region, or the lowest level since November 2025, and lower for the third consecutive day on Wednesday. Spot prices slide back below the 1.1600 mark during the Asian session and seem vulnerable to slide further.

GBP/USD slips below key averages as geopolitical risks mount

GBP/USD fell about 0.35% on Tuesday, settling around 1.3350 after slipping below the 200-day Exponential Moving Average for the first time since early December. The pair has pulled back sharply from its late-January high near 1.3870, shedding over 500 pips in a series of lower highs and lower lows. 

Gold rebounds ahead of US ADP, will it last?

Gold finds renewed Asian bids and retests $5,230 early Wednesday after the heavy sell-off on Tuesday. The US Dollar stands tall amid escalating Middle East tensions and reduced dovish Fed expectations. Gold defends $5,000 or 50% Fibo level after facing rejection at the 78.6% Fibo resistance at $5,342 amid bullish RSI.  

Ethereum: Whales step up buying as short positions contract

After holding firm heading into the last weekend, Ethereum whales have returned to action, pouncing on the volatility stemming from escalating military actions between the US and Iran.

Energy shock 2.0: Why rising Gas prices could hit the Euro

Even without a confirmed, sustained disruption, the mere risk to a key global energy chokepoint is enough to inject a significant premium into European Gas markets. And for the Euro, that matters.

Ripple falters amid sell-off jitters and negative funding rates

Ripple (XRP) has come under pressure, drifting lower to $1.35 at the time of writing on Tuesday. The over 2% correction looks poised to erase the previous day’s gains, which lifted the remittance token to $1.42.