|
GBP/USD technical analysis: Cable hovering near weekly lows sub-1.2700 figure
- GBP/USD is trading near its weekly low below the 1.2700 figure.
- The level to beat for bears is 1.2659 support.
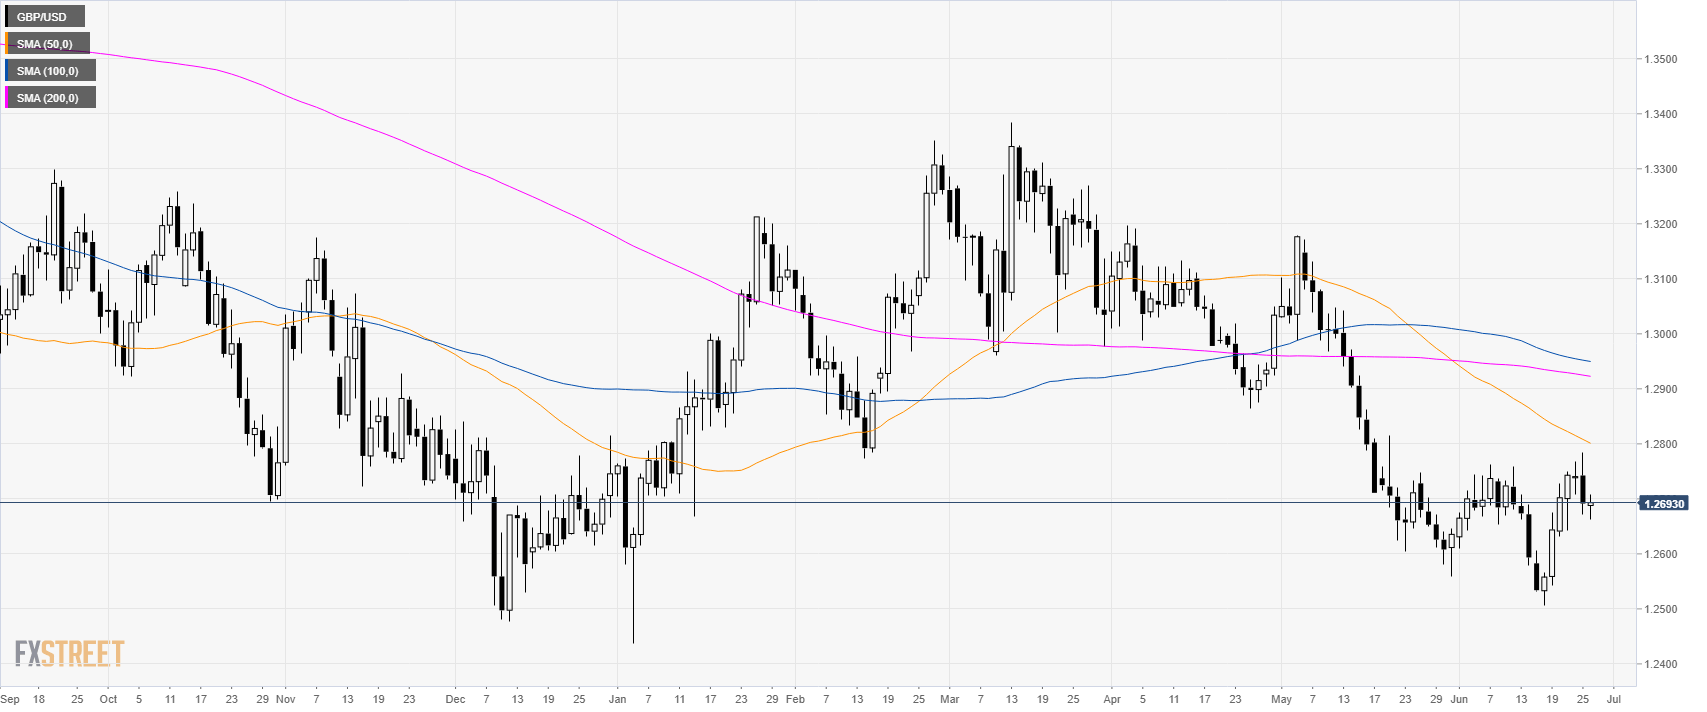
GBP/USD daily chart
GBP/USD is trading in a bear trend below its main daily simple moving averages (DSMAs). The market is challenging the 1.2700 figure to the downside near weekly lows.
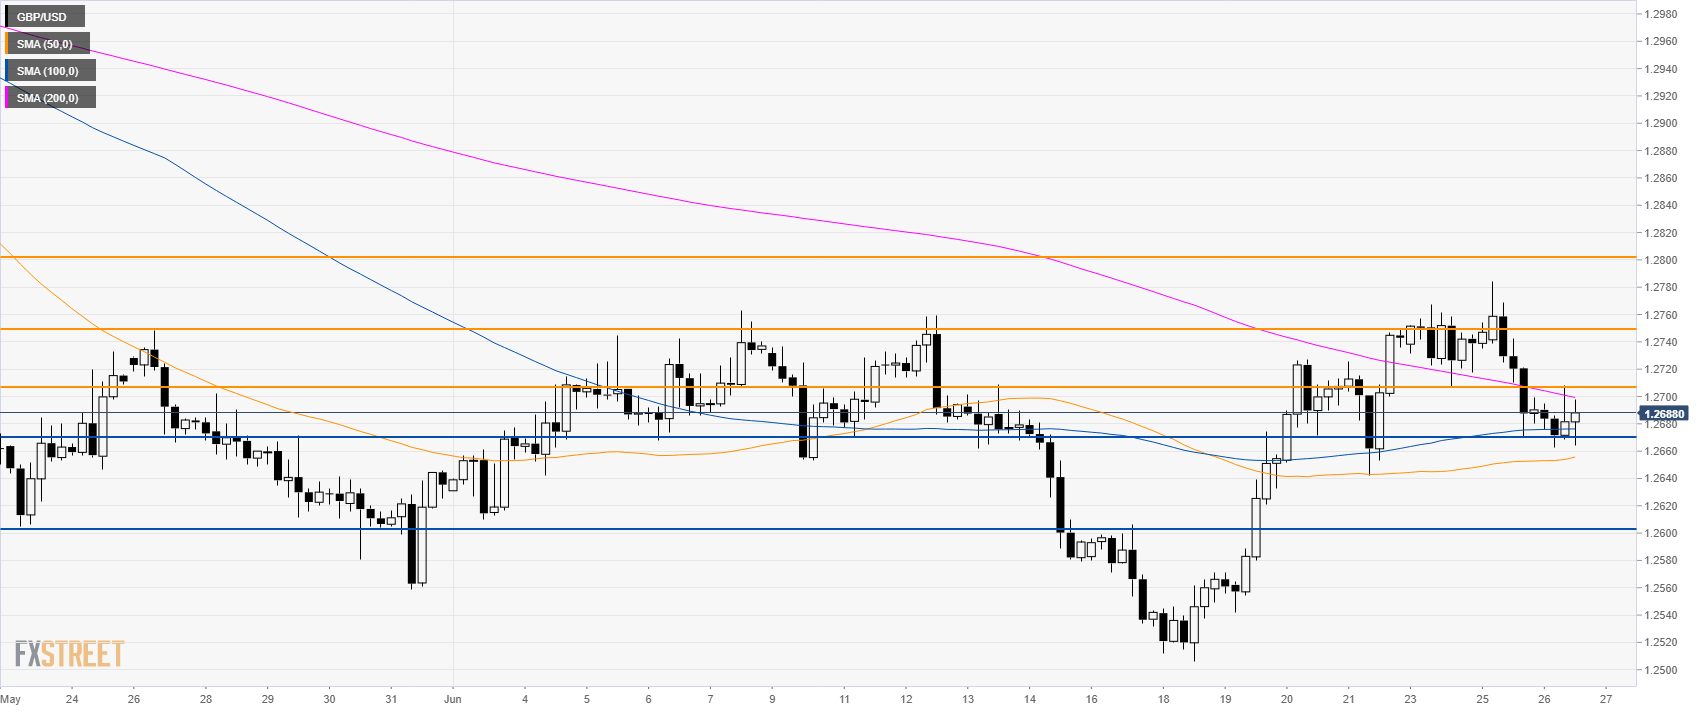
GBP/USD 4-hour chart
Cable is trading just below the 200 SMA suggesting potential bearish momentum in the medium term. The level to beat for bears is at 1.2659. If broken 1.2603 can be next for sellers, according to the Technical Confluences Indicator.

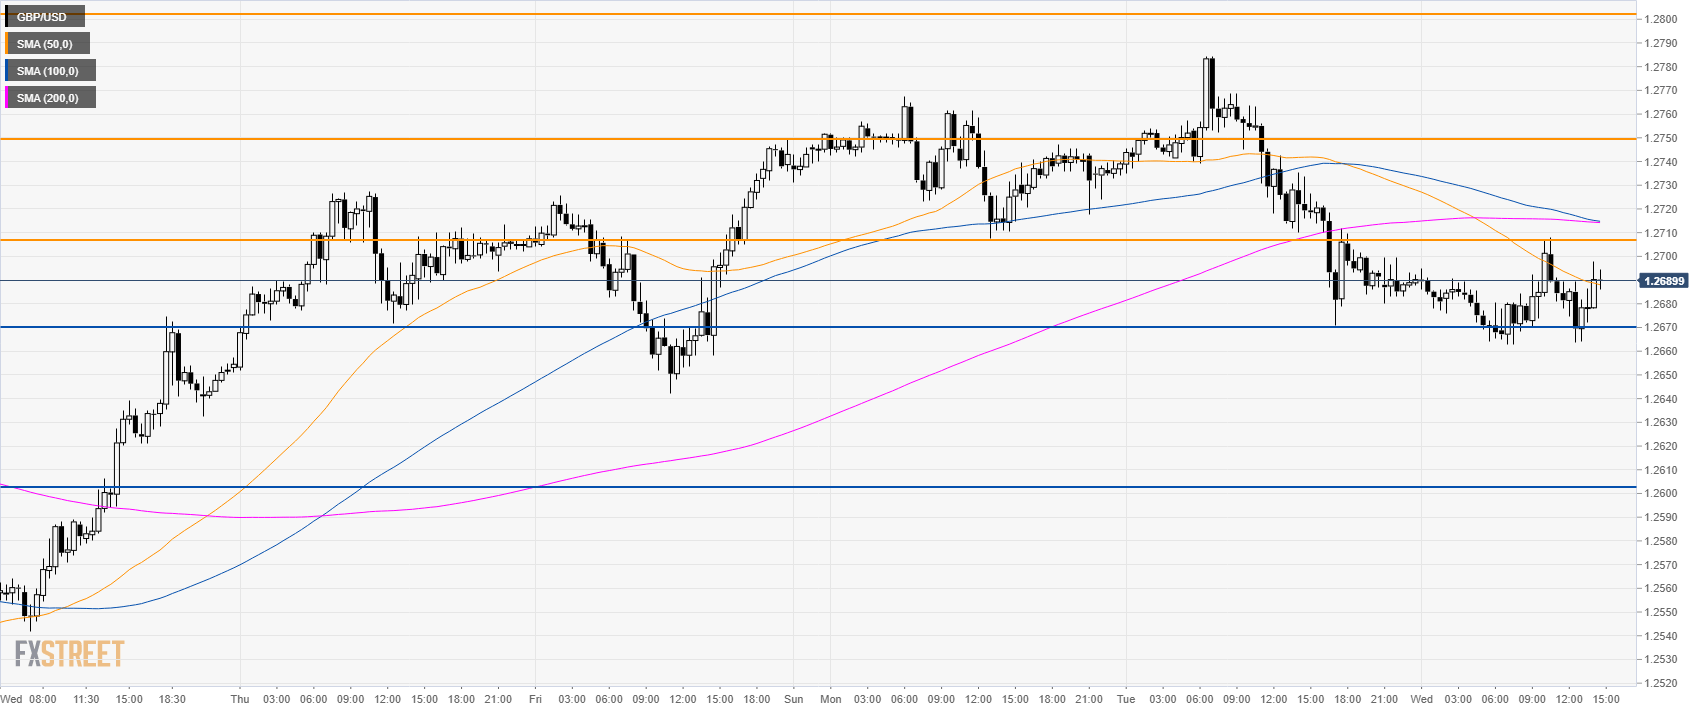
GBP/USD 30-minute chart
GBP/USD is trading below 1.2706 resistance and its 100/200 SMAs suggesting a potential correction down in the near term. Resistances are seen at 1.2706, 1.2750 and 1.2800 levels according to the Technical Confluences Indicator.

Additional key levels
Author

Flavio Tosti
Independent Analyst
More from Flavio Tosti


