|
GBP/USD technical analysis: Cable easing from multi-week highs, sub-1.2470 level
- The Sterling had a strong move to the upside this Friday in what could be climactic buying.
- GBP/USD is correcting down. Immediate support is seen at the 1.2405 price level.

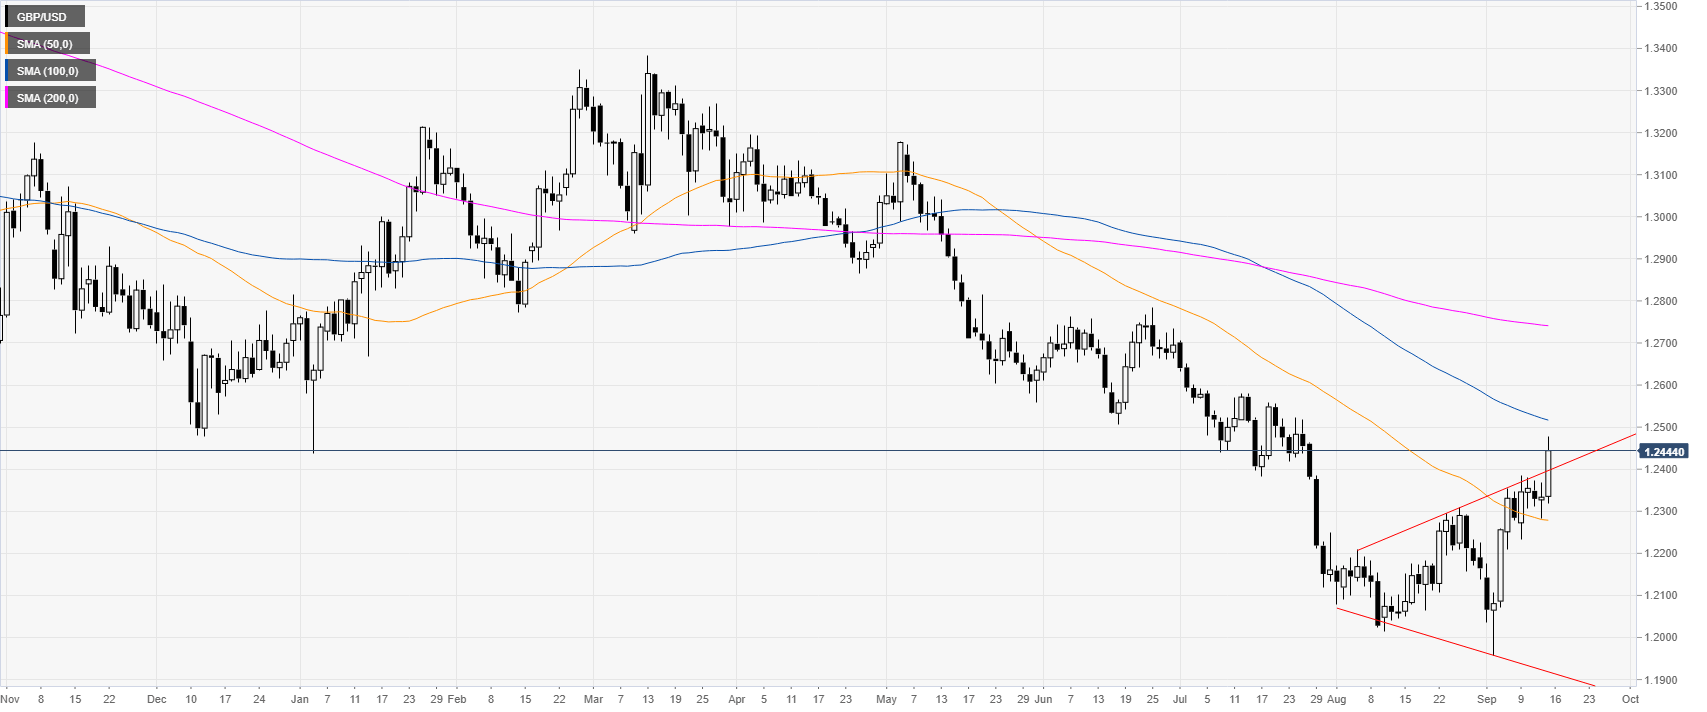
GBP/USD daily chart
The Pound is trading in a bear trend below the 100 and 200-day simple moving averages (SMAs). However, the market has been rebounding in August and September in what can be an expanding triangle formation.
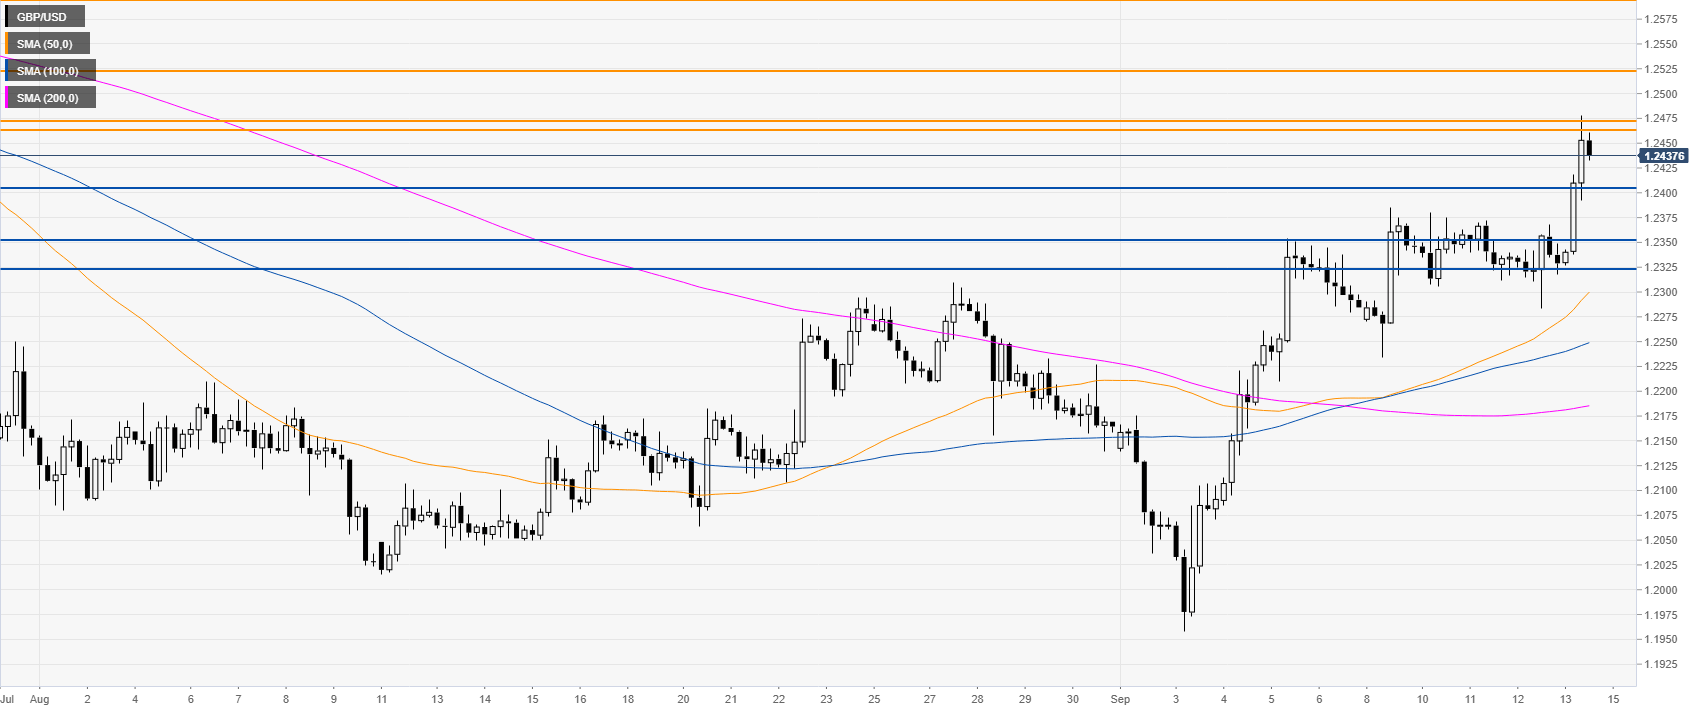
GBP/USD four-hour chart
GBP/USD is trading well above its main SMAs as the market got a strong boost to the 1.2464/77 resistance zone. A break of this zone is necessary for the market to climb higher towards 1.2520 and 1.2594 resistances, according to the Technical Confluences Indicator.
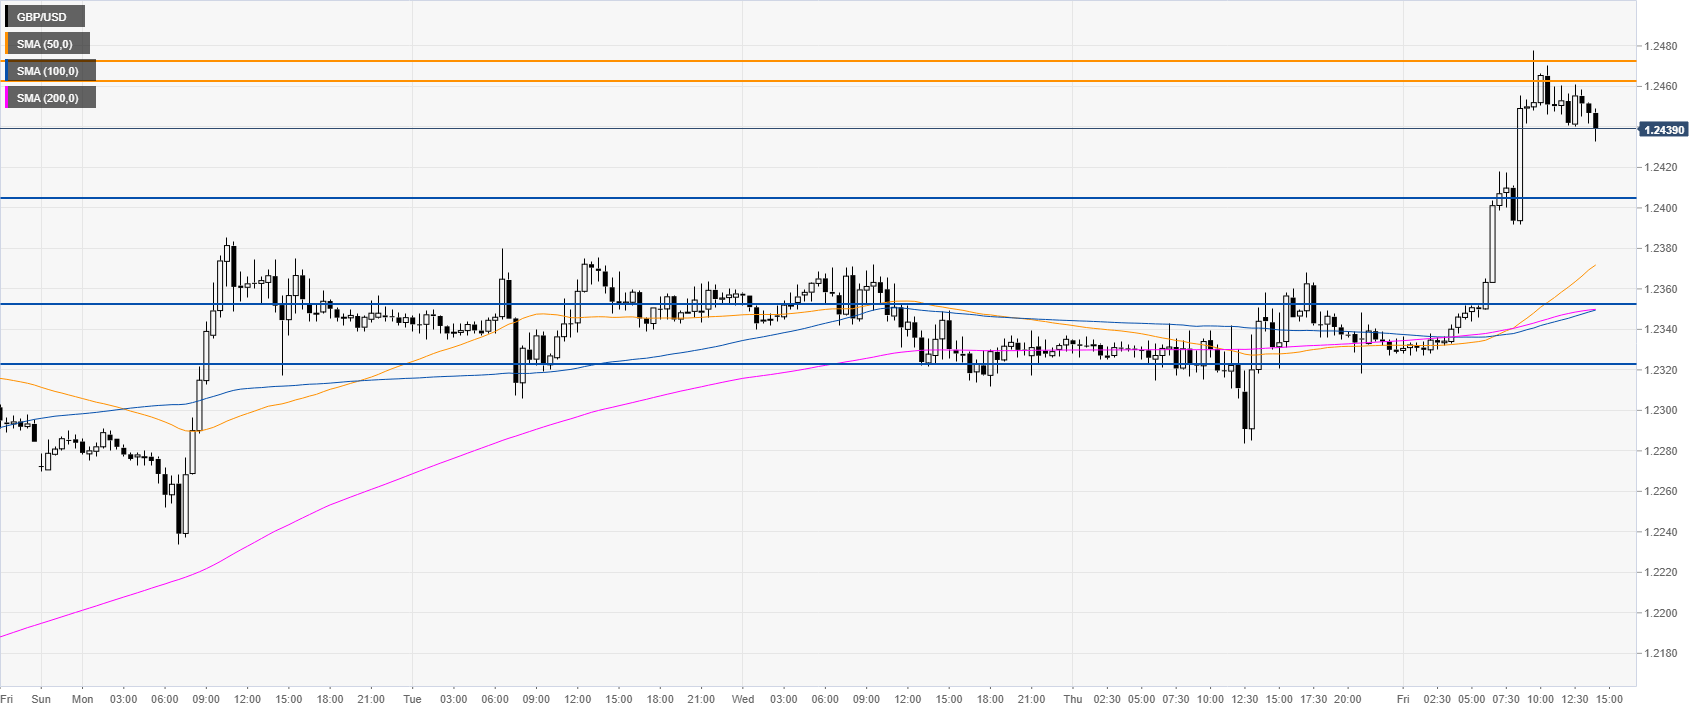
GBP/USD 30-minute chart
The Sterling is trading at weekly tops well above its main SMAs. If the bears consider the recent move as climactic the market is set to consolidate down towards 1.2405, 1.2355 and 1.2322, according to the Technical Confluences Indicator.
Additional key levels
Author

Flavio Tosti
Independent Analyst
More from Flavio Tosti


