|

GBP/USD technical analysis: Cable eases from daily highs, trading sub-1.2085 resistance

  • GBP/USD bear trend is intact as the market fell to new multi-month lows this Monday.
  • The levels to beat for bears are seen at 1.2060 and 1.2036 supports.
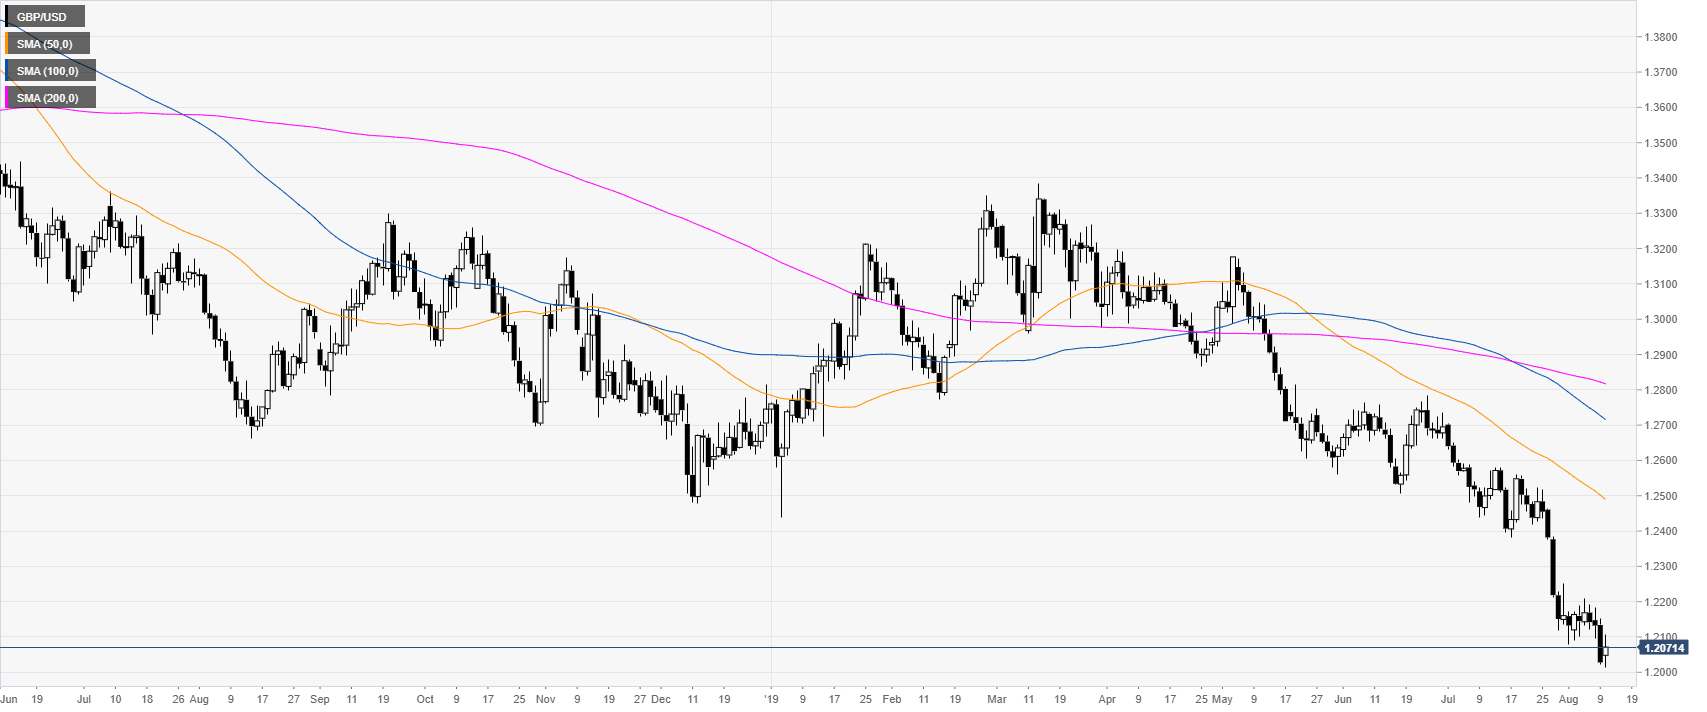


GBP/USD daily chart

 
Cable is under heavy bearish pressure as the market hit a new multi-month lows at the 1.2015 level this Monday.
 

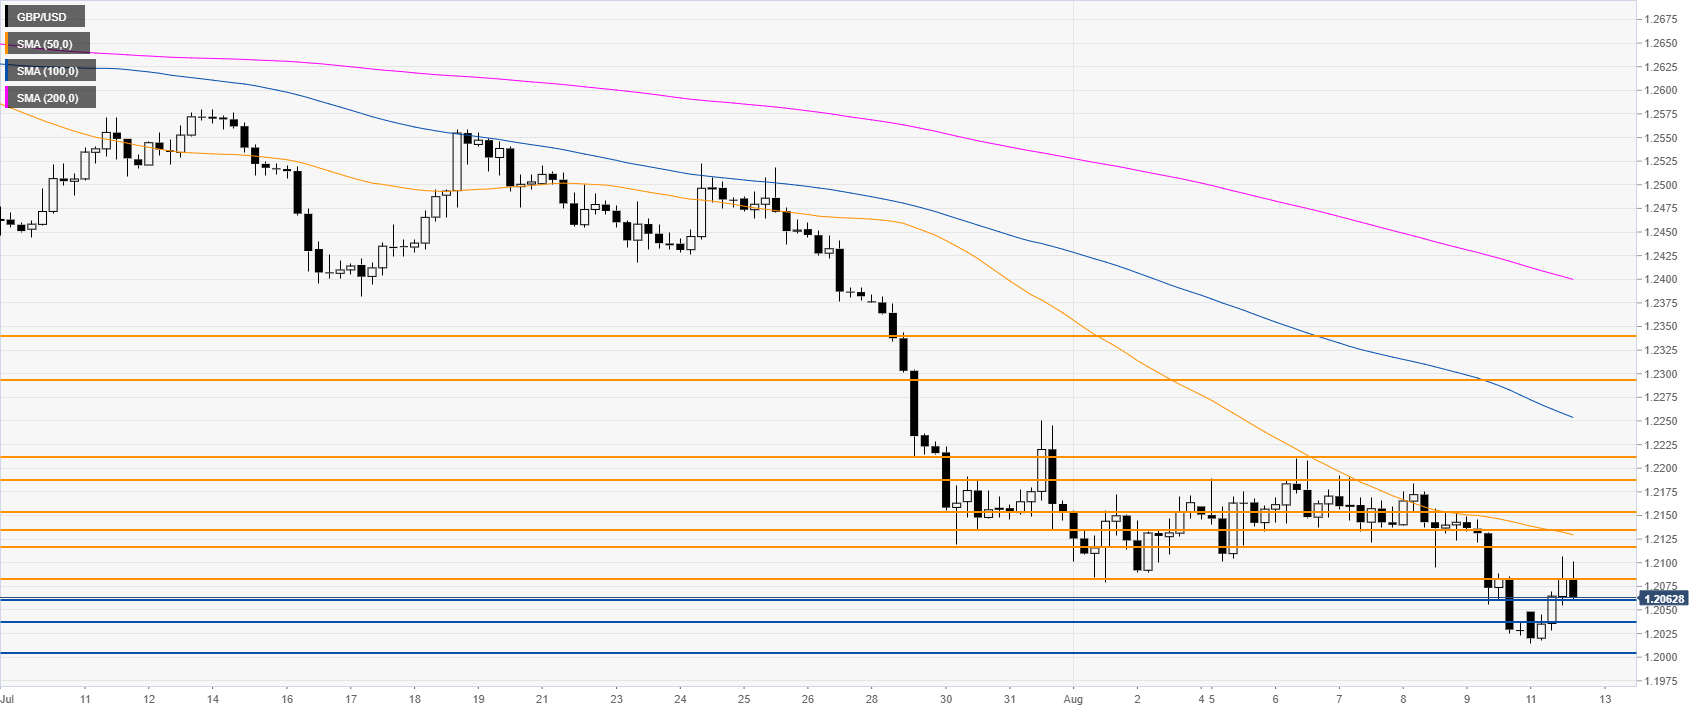
GBP/USD 4-hour chart

 
GBP/USD is trading below its main simple moving averages (SMAs), suggesting a negative bias in the medium term. The market failed to recover above the 1.2085 resistance. Bulls will have lots of resistance to overcome if they intend to create a meaningful recovery. They need to overcome the 1.2085 and 1.2116 resistances, followed by the 1.2135 and 1.2154 levels. 


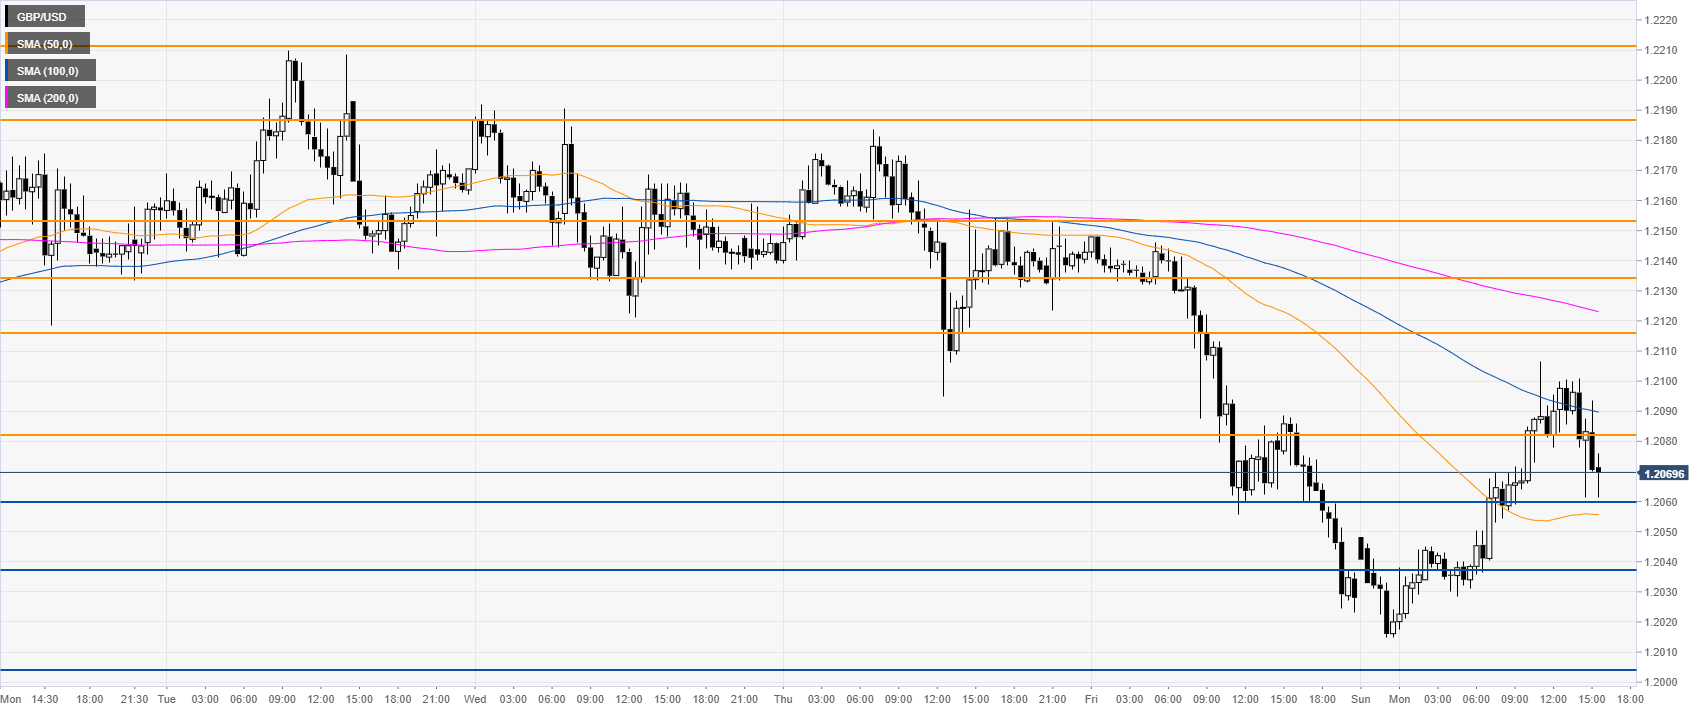
GBP/USD 30-minute chart


Cable is rejecting the current daily high near the 1.2100 figure and the 50 SMA. Bears want to break below 1.2060 and 1.2036 levels to reach 1.2003 on the way down, according to the Technical Confluences Indicator.


Additional key levels

GBP/USD

Overview
Today last price1.2067
Today Daily Change0.0039
Today Daily Change %0.32
Today daily open1.2028
 
Trends
Daily SMA201.2304
Daily SMA501.2502
Daily SMA1001.2727
Daily SMA2001.2822
Levels
Previous Daily High1.2154
Previous Daily Low1.2023
Previous Weekly High1.221
Previous Weekly Low1.2023
Previous Monthly High1.2706
Previous Monthly Low1.2119
Daily Fibonacci 38.2%1.2073
Daily Fibonacci 61.8%1.2104
Daily Pivot Point S11.1983
Daily Pivot Point S21.1938
Daily Pivot Point S31.1852
Daily Pivot Point R11.2113
Daily Pivot Point R21.2199
Daily Pivot Point R31.2244

Author

Flavio Tosti

Flavio Tosti

Independent Analyst


More from Flavio Tosti
Share:

Editor's Picks

EUR/USD tests nine-day EMA support near 1.1850

EUR/USD inches lower during the Asian hours on Monday, trading around 1.1870 at the time of writing. The 14-day Relative Strength Index momentum indicator at 56 stays above the midline, confirming improving momentum. RSI has cooled from prior overbought readings but stabilizes above 50, suggesting dips could stay limited before buyers reassert control.

GBP/USD flat lines as traders await key UK macro data and FOMC minutes

The GBP/USD pair kicks off a new week on a subdued note and oscillates in a narrow range, just below mid-1.3600s, during the Asian session. Moreover, the mixed fundamental backdrop warrants some caution for aggressive traders as the market focus now shifts to this week's important releases from the UK and the US.

Gold buyers hesitate amid holiday-thinned trading

Gold trades volatile, but within range, as US, China holidays-led thin trading exaggerates moves. The US Dollar extends range play into the US GDP week, with markets pricing at least two Fed rate cuts this year. Technically, Gold tests key support at $5,000; daily RSI still remains bullish.

Top Crypto Losers: Dogecoin, Zcash, Bonk – Meme and Privacy coins under pressure

Meme coins such as Dogecoin and Bonk, alongside the privacy coin Zcash (ZEC), are leading the broader market losses over the last 24 hours. DOGE, ZEC, and BONK ended their three consecutive days of recovery with a sudden decline on Sunday, as crucial resistance levels capped the gains. Technically, the altcoins show downside risk, starting the week under pressure.

Global inflation watch: Signs of cooling services inflation

Realized inflation landed close to expectations in January, as negative base effects weighed on the annual rates. Remaining sticky inflation is largely explained by services, while tariff-driven goods inflation remains limited even in the US.

Ripple Price Forecast: XRP potential bottom could be in sight

Ripple edges up above the intraday low of $1.35 at the time of writing on Friday amid mixed price actions across the crypto market. The remittance token failed to hold support at $1.40 the previous day, reflecting risk-off sentiment amid a decline in retail and institutional sentiment.