|

GBP/USD technical analysis: Cable clinging to daily gains at monthly highs

  • GBP/USD is trading near its highest point in August, hitting 1.2310 on an intraday basis.
  • The levels to beat for bulls are seen at 1.2329, followed by 1.2361 resistances.
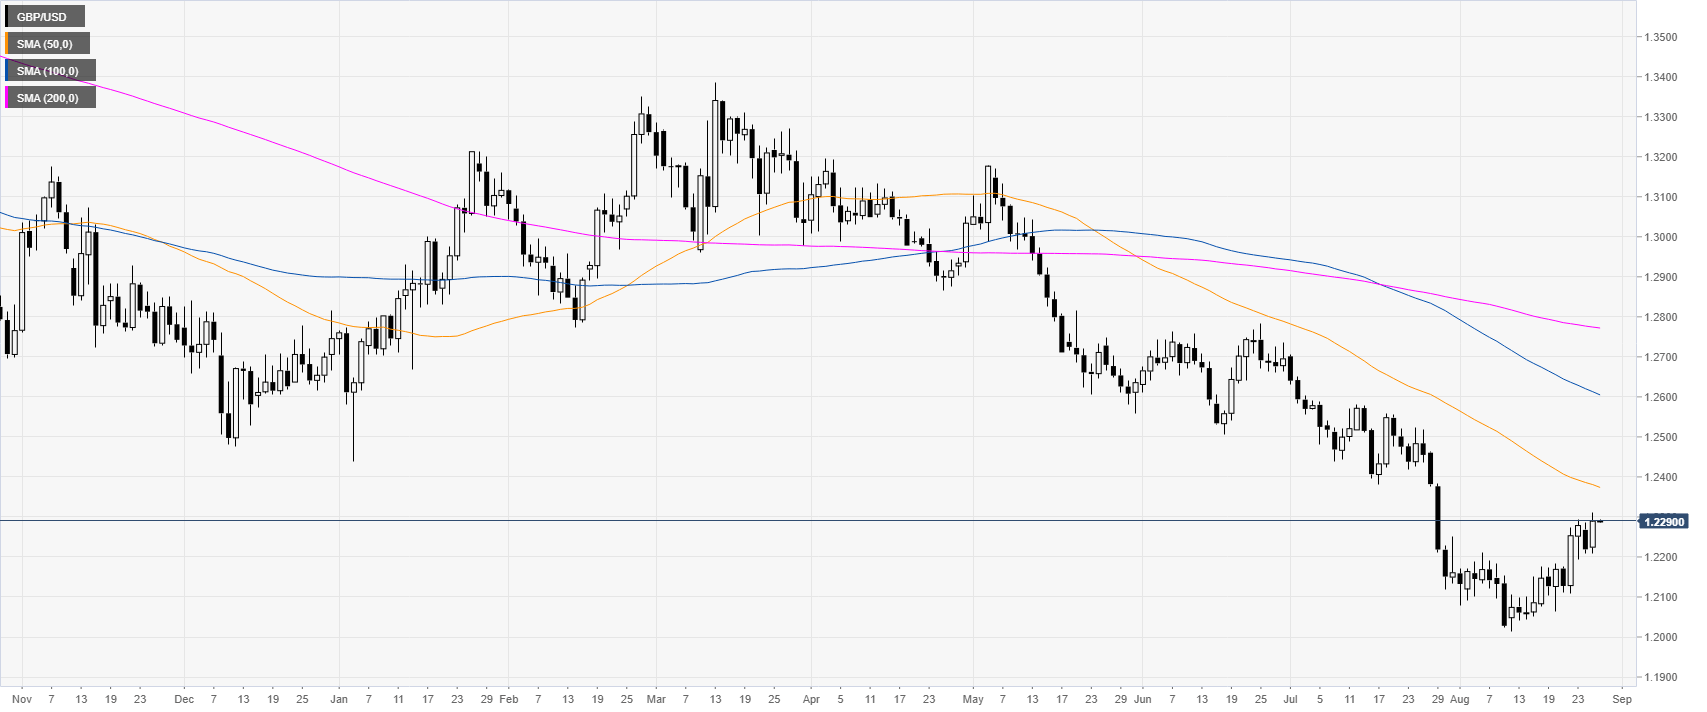
 

GBP/USD daily chart

 
GBP/USD is trading in a bear trend below the main daily simple moving averages (SMAs). However, in the last two weeks, the market has been bouncing after printing a 2019 low at the 1.2015 level.

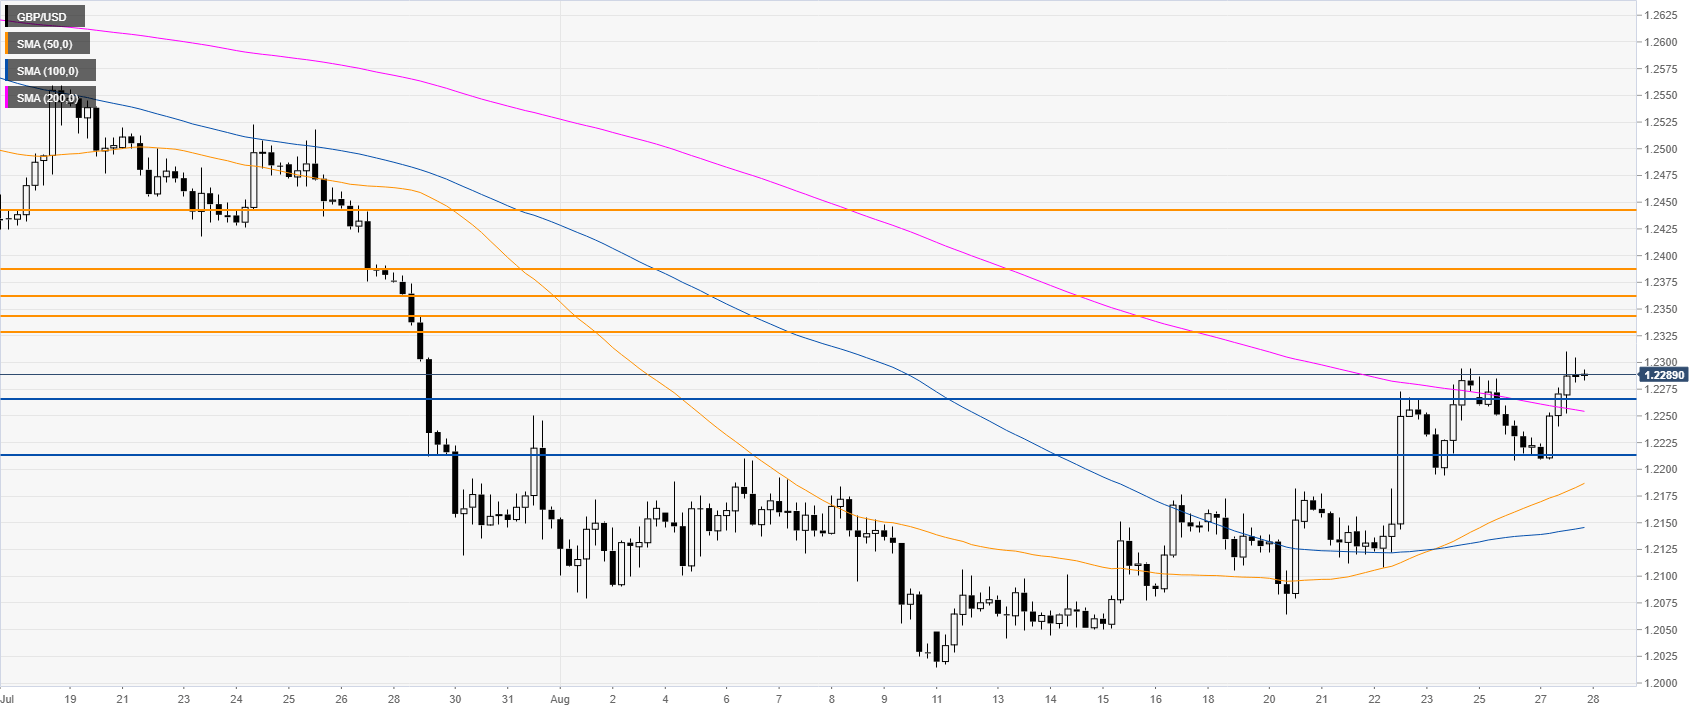
GBP/USD 4-hour chart

 
The Cable broke to a new August high above the 200 SMA on the 4-hour time frame. Bulls have now a thick cluster of resistance to go through. If the buyers manage to pierce 1.2329/1.2348 and 1.2361, the market may reach 1.2386 on the way up, according to the Technical Confluences Indicator.
  

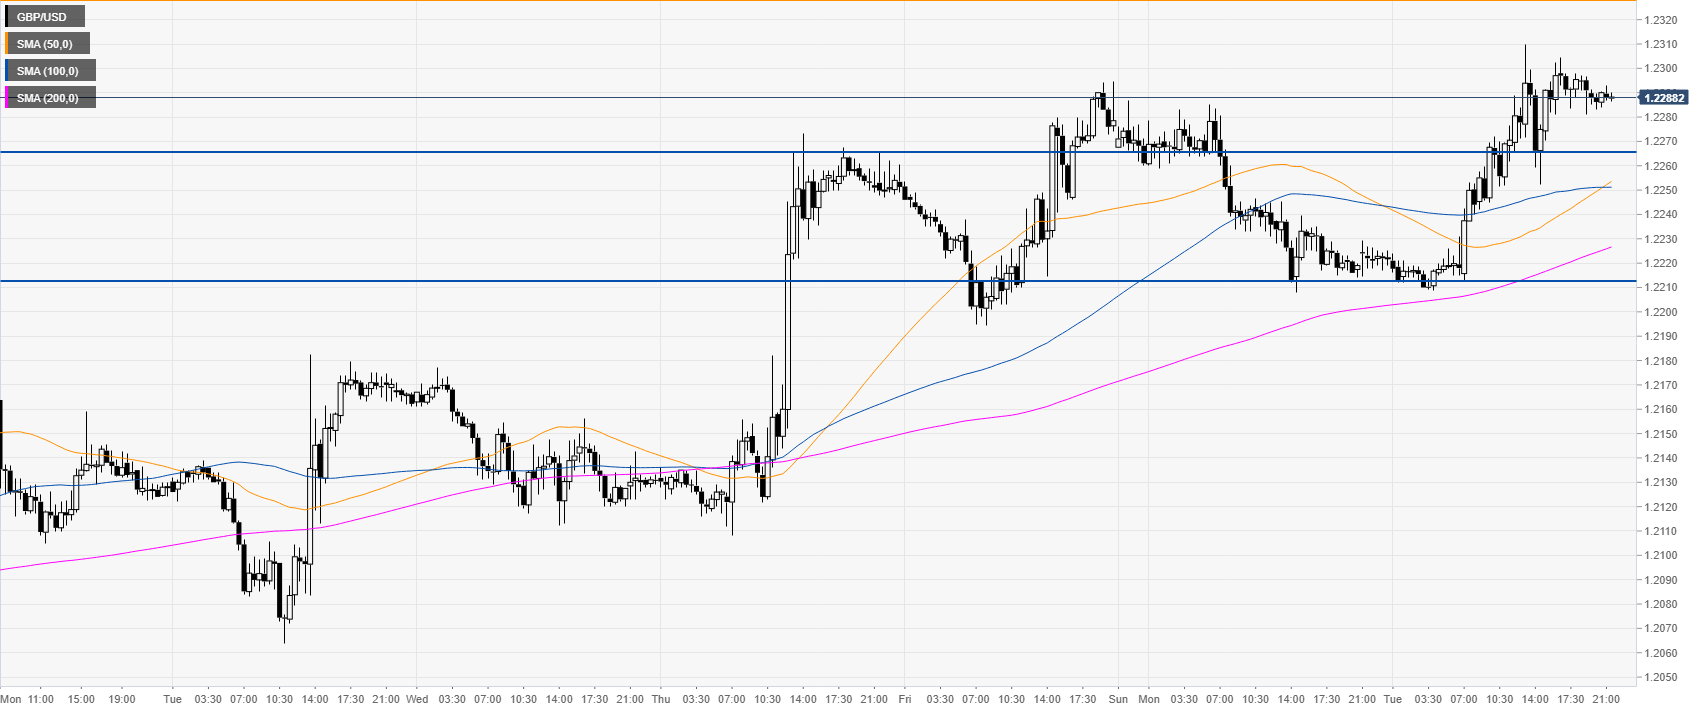
GBP/USD 30-minute chart

 
GBP/USD is trading above its main SMAs, suggesting a bullish bias in the short term. Immediate supports are seen at 1.2265 and 1.2214 levels.

Additional key levels

GBP/USD

Overview
Today last price1.2288
Today Daily Change0.0069
Today Daily Change %0.56
Today daily open1.2219
 
Trends
Daily SMA201.2141
Daily SMA501.2386
Daily SMA1001.2621
Daily SMA2001.2777
Levels
Previous Daily High1.2287
Previous Daily Low1.2208
Previous Weekly High1.2294
Previous Weekly Low1.2064
Previous Monthly High1.2706
Previous Monthly Low1.2119
Daily Fibonacci 38.2%1.2238
Daily Fibonacci 61.8%1.2257
Daily Pivot Point S11.2189
Daily Pivot Point S21.2159
Daily Pivot Point S31.211
Daily Pivot Point R11.2268
Daily Pivot Point R21.2317
Daily Pivot Point R31.2347

Author

Flavio Tosti

Flavio Tosti

Independent Analyst


More from Flavio Tosti
Share:

Markets move fast. We move first.

Orange Juice Newsletter brings you expert driven insights - not headlines. Every day on your inbox.

By subscribing you agree to our Terms and conditions.

Editor's Picks

EUR/USD bounces toward 1.1750 as US Dollar loses strength

EUR/USD returned to the 1.1750 price zone in the American session on Friday, despite falling Wall Street, which indicates risk aversion. Trading conditions remain thin following the New Year holiday and ahead of the weekend, with the focus shifting to US employment and European data scheduled for next week.

GBP/USD nears 1.3500, holds within familiar levels

After testing 1.3400 on the last day of 2025, GBP/USD managed to stage a rebound. Nevertheless, the pair finds it difficult to gather momentum and trades with modest intraday gains at around 1.3490 as market participants remain in holiday mood.

Gold trims intraday gains, approaches $4,300

Gold retreated sharply from the $4,400  area and trades flat for the day in the $4,320 price zone. Choppy trading conditions exacerbated the intraday decline, although XAU/USD bearish case is out of the picture, considering growing expectations for a dovish Fed and persistent geopolitical tensions.

Cardano gains early New Year momentum, bulls target falling wedge breakout

Cardano kicks off the New Year on a positive note and is extending gains, trading above $0.36 at the time of writing on Friday. Improving on-chain and derivatives data point to growing bullish interest, while the technical outlook keeps an upside breakout in focus.

Economic outlook 2026-2027 in advanced countries: Solidity test

After a year marked by global economic resilience and ending on a note of optimism, 2026 looks promising and could be a year of solid economic performance. In our baseline scenario, we expect most of the supportive factors at work in 2025 to continue to play a role in 2026.

Crypto market outlook for 2026

Year 2025 was volatile, as crypto often is.  Among positive catalysts were favourable regulatory changes in the U.S., rise of Digital Asset Treasuries (DAT), adoption of AI and tokenization of Real-World-Assets (RWA).