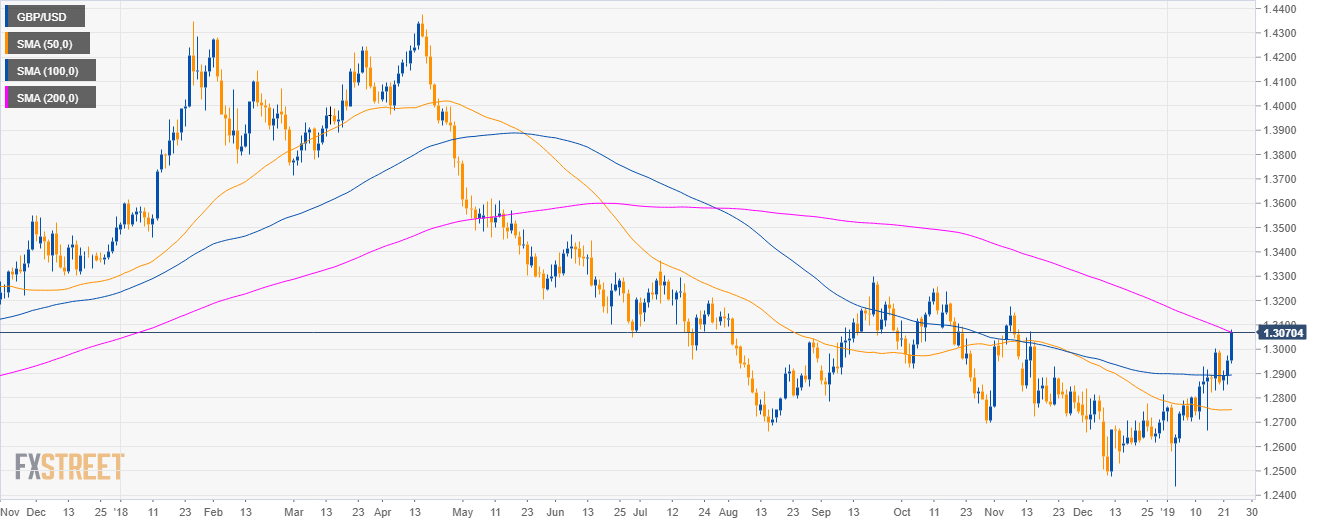
GBP/USD daily chart
- GBP/USD is evolving in a bear trend below its 200-day simple moving averages (SMA) on the daily chart.
- However, bulls have reclaimed the 50 and 100 SMAs and they are now testing the 200 SMA, all suggesting intense bullish activity.
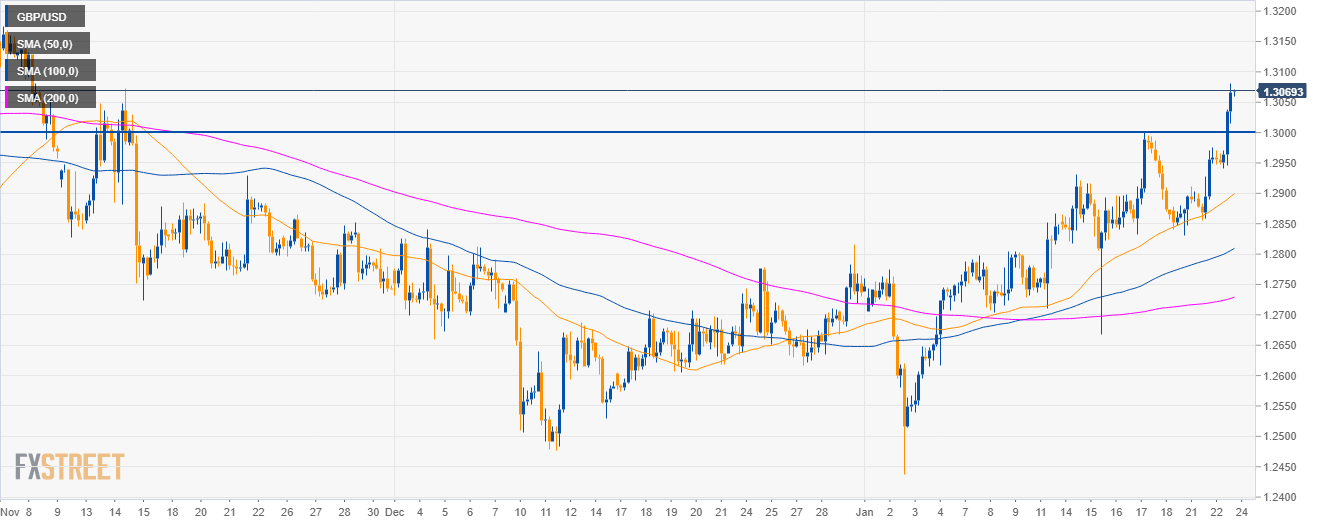
GBP/USD 4-hour chart
- GBP/USD is trading above the main SMAs and the 1.3000 round figure suggesting bullish momentum in the medium-term.
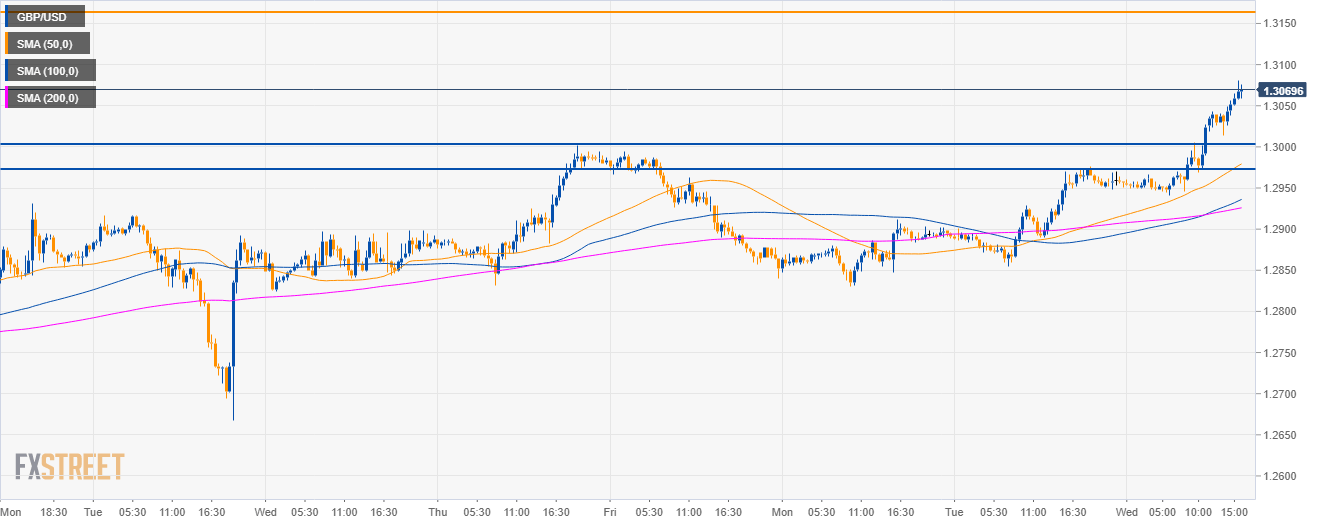
GBP/USD 30-minute chart
- GBP/USD is trading above its main SMAs suggesting bullish strength.
- Bulls show no signs of stopping their advance and the target to the upside can be seen at the 1.3160 level in the coming sessions.
- Support is seen at the 1.3000 figure and 1.2970 level.
Additional key levels
GBP/USD
Overview:
Today Last Price: 1.3069
Today Daily change: 117 pips
Today Daily change %: 0.90%
Today Daily Open: 1.2952
Trends:
Daily SMA20: 1.2785
Daily SMA50: 1.2751
Daily SMA100: 1.2892
Daily SMA200: 1.3079
Levels:
Previous Daily High: 1.2976
Previous Daily Low: 1.2855
Previous Weekly High: 1.3002
Previous Weekly Low: 1.2668
Previous Monthly High: 1.284
Previous Monthly Low: 1.2477
Daily Fibonacci 38.2%: 1.293
Daily Fibonacci 61.8%: 1.2901
Daily Pivot Point S1: 1.288
Daily Pivot Point S2: 1.2807
Daily Pivot Point S3: 1.2759
Daily Pivot Point R1: 1.3001
Daily Pivot Point R2: 1.3049
Daily Pivot Point R3: 1.3122
Note: All information on this page is subject to change. The use of this website constitutes acceptance of our user agreement. Please read our privacy policy and legal disclaimer. Opinions expressed at FXstreet.com are those of the individual authors and do not necessarily represent the opinion of FXstreet.com or its management. Risk Disclosure: Trading foreign exchange on margin carries a high level of risk, and may not be suitable for all investors. The high degree of leverage can work against you as well as for you. Before deciding to invest in foreign exchange you should carefully consider your investment objectives, level of experience, and risk appetite. The possibility exists that you could sustain a loss of some or all of your initial investment and therefore you should not invest money that you cannot afford to lose. You should be aware of all the risks associated with foreign exchange trading, and seek advice from an independent financial advisor if you have any doubts.
Recommended content
Editors’ Picks
EUR/USD edges lower toward 1.0700 post-US PCE

EUR/USD stays under modest bearish pressure but manages to hold above 1.0700 in the American session on Friday. The US Dollar (USD) gathers strength against its rivals after the stronger-than-forecast PCE inflation data, not allowing the pair to gain traction.
GBP/USD retreats to 1.2500 on renewed USD strength

GBP/USD lost its traction and turned negative on the day near 1.2500. Following the stronger-than-expected PCE inflation readings from the US, the USD stays resilient and makes it difficult for the pair to gather recovery momentum.
Gold struggles to hold above $2,350 following US inflation

Gold turned south and declined toward $2,340, erasing a large portion of its daily gains, as the USD benefited from PCE inflation data. The benchmark 10-year US yield, however, stays in negative territory and helps XAU/USD limit its losses.
Bitcoin Weekly Forecast: BTC’s next breakout could propel it to $80,000 Premium

Bitcoin’s recent price consolidation could be nearing its end as technical indicators and on-chain metrics suggest a potential upward breakout. However, this move would not be straightforward and could punish impatient investors.
Week ahead – Hawkish risk as Fed and NFP on tap, Eurozone data eyed too

Fed meets on Wednesday as US inflation stays elevated. Will Friday’s jobs report bring relief or more angst for the markets? Eurozone flash GDP and CPI numbers in focus for the Euro.