GBP/USD technical analysis: 50-HMA can toughen road to recovery
- USD weakness stops limit further downside.
- Recovery can be challenged by immediate resistance-confluence and 200-HMA.
Despite refraining from additional declines due to the recent US Dollar (USD) weakness, the GBP/USD pair still trades under near-term resistances as it seesaws around 1.2615 during the initial Asian session on Friday.
In addition to a downward sloping trend-line since early-week, 50-hour simple moving average (50-HMA) challenges the quote’s latest recovery around 1.2625/30, a break of which can escalate the up-moves to 1.2650/55 resistance-zone comprising mid-week extremes.
Should there be an additional upside past-1.2655, 200-HMA near 1.2675 and 61.8% Fibonacci retracement of current week decline at 1.2685 can question buyers targeting 1.2720 and 1.2750.
Meanwhile, 1.2600 and 1.2580 could keep limiting the pair’s near-term declines ahead of dragging it to 1.2480.
If prices keep trading southwards under 1.2480, the current year low of 1.2430 and 1.2400 round-figure may as well be called important to watch.
GBP/USD hourly chart
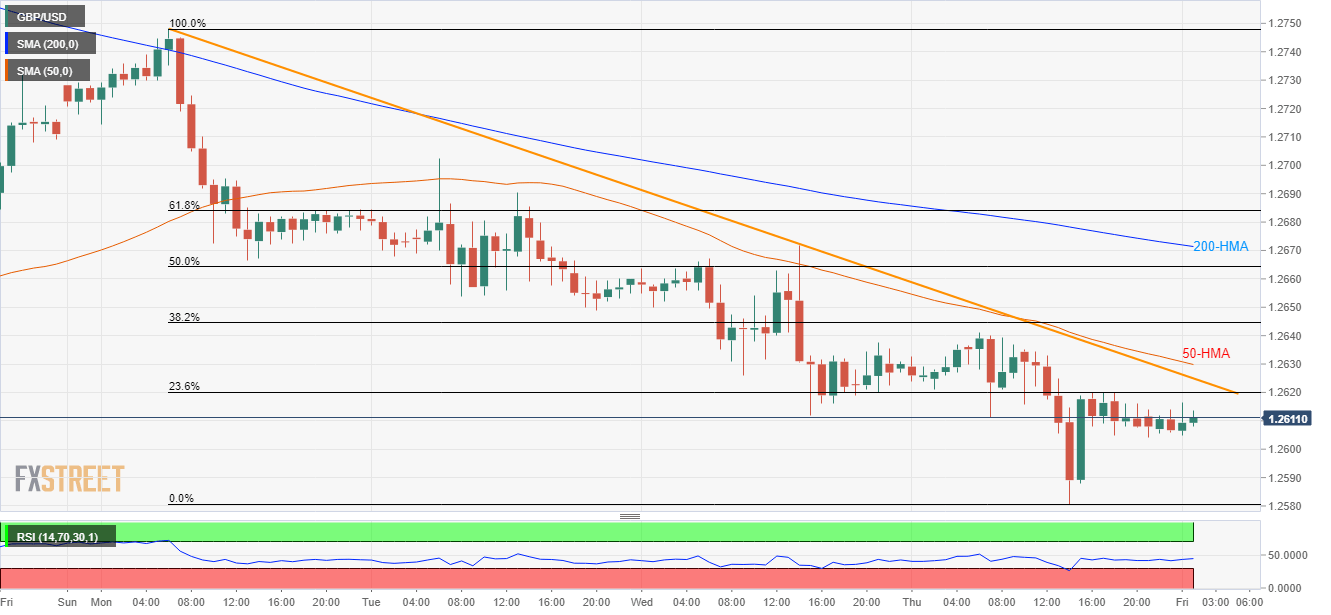
Trend: Bearish
Author

Anil Panchal
FXStreet
Anil Panchal has nearly 15 years of experience in tracking financial markets. With a keen interest in macroeconomics, Anil aptly tracks global news/updates and stays well-informed about the global financial moves and their implications.


