|

GBP/USD soaring into 1.24, set for its best trading day since March

  • The GBP/USD is accelerating recent gains, set to end the week near 1.2400.
  • The Pound Sterling is on track to chalk in its single best trading day since March.
  • US NFP data miss is sending the Greenback broadly lower, giving a hand to riskier assets.

The GBP/USD is climbing into the 1.2400 handle to cap off a trading week that saw the pair mostly flounder around the averages.

After US Nonfarm Payrolls (NFP) came in well below expectations the Pound Sterling (GBP) climbed 1.6% from Friday's opening bids near 1.2190, and the GPB/USD is up almost 2.5% from the week's lows of 1.2095.

US Nonfarm Payrolls increase by 150,000 in October vs. 180,000 forecast

US NFP figures came in below expectations, printing at its worst headline figure in almost three years. The US added 150K new jobs in October, missing the market forecast of 180K and coming in well below September's print of 297K, which was revised downwards from the initial print of 336K.

The US NFP jobs miss is sending the US Dollar (USD) lower across the broader market as investors splurge on risk assets with souring US labor data counter-intuitively inspiring investors to move out of safe havens. Softening US data will give the Federal Reserve (Fed) cause for pause on interest rates as investors look for signs that the Fed will begin accelerating the schedule for eventual rate cuts.

GBP/USD Technical Outlook

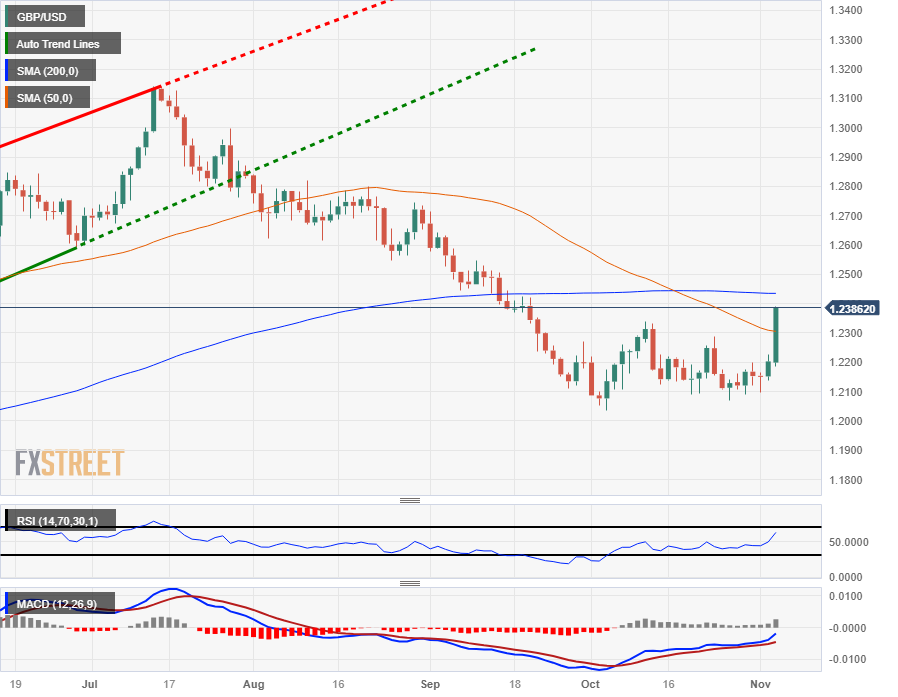
The Sterling's NFP-fueled climb sees the GBP/USD climbing straight through the 50-day Simple Moving Average (SMA), aimed directly at the 1.2400 handle and set for a challenge of the 200-day SMA currently grinding sideways from 1.2435.

The GBP/USD has been cycling between 1.2300 and 1.2100 recently, and a bearish fallback will see the pair slumping back into multi-month lows towards the 1.2000 major handle.

GBP/USD Daily Chart

GBP/USD Technical Levels

GBP/USD

Overview
Today last price1.2382
Today Daily Change0.0179
Today Daily Change %1.47
Today daily open1.2203
 
Trends
Daily SMA201.2184
Daily SMA501.2309
Daily SMA1001.2551
Daily SMA2001.2435
 
Levels
Previous Daily High1.2226
Previous Daily Low1.2138
Previous Weekly High1.2289
Previous Weekly Low1.207
Previous Monthly High1.2337
Previous Monthly Low1.2037
Daily Fibonacci 38.2%1.2192
Daily Fibonacci 61.8%1.2171
Daily Pivot Point S11.2152
Daily Pivot Point S21.2101
Daily Pivot Point S31.2065
Daily Pivot Point R11.224
Daily Pivot Point R21.2276
Daily Pivot Point R31.2327

Author

Joshua Gibson

Joshua joins the FXStreet team as an Economics and Finance double major from Vancouver Island University with twelve years' experience as an independent trader focusing on technical analysis.

More from Joshua Gibson
Share:

Editor's Picks

AUD/USD falls to near 0.7100 after slipping below 50-day EMA

AUD/USD depreciates after registering minor gains in the previous day, trading around 0.7120 during the Asian hours. The technical analysis of the daily chart shows the pair consolidating sideways within a rectangle pattern, as neither bulls nor bears gain control. The AUD/USD pair is holding a slight bearish tone however as it sits beneath both the nine-day and 50-day EMAs.

160.00: USD/JPY back near intervention territory after upbeat US jobs report

US Nonfarm Payrolls beat expectations by a wide margin in May, with 172K jobs added. The US Dollar rebounds after the release, helping USD/JPY recover from its intraday lows. Warnings from Japanese authorities continue to limit upside potential near the 160.00 threshold.

Gold targets $4,300 amid stronger Dollar

Gold faces increasing selling interest and navigates the area of three-month lows near the $4,300 mark per troy ounce on Friday. The precious metal’s decline comes as traders assess the stronger-than-expected NFP, while the bid bias in the Greenback and higher US Treasury yields also collaborate with the retracement.

Cardano hits five-year low even as Hoskinson clarifies "break" isn't an exit

Cardano (ADA) price is down 10% at press time on Friday, extending losses over 30% so far this week amid Charles Hoskinson's clarification that "break" isn't an exit.

Week ahead – Fed countdown begins amid US inflation data and geopolitical risks

Fed Chair Warsh’s first meeting approaches as key US inflation data could reshape expectations. Oil prices remain elevated as US-Iran talks continue; tariffs also return to the spotlight. ECB is expected to hike; will it be a one-off move or is July live?

The US economy defies the rules: 100 days into the Oil shock and the recession signal is still missing

More than three months after the start of the Iran war and the resulting disruption to global energy markets, the US economy continues to display remarkable resilience. The conflict has triggered a sharp rise in Oil prices, reignited inflationary pressures and fueled widespread concerns about a potential economic slowdown.