GBP/USD slips below 1.2600 as the early week's selloff extends into Tuesday
- The GBP/USD is seeing continued selling pressure, declining below 1.2600.
- The Pound Sterling is descending into new lows for the week.
- Mixed US data is propping up the US Dollar on Tuesday as market sentiment shifts underfoot.

The GBP/USD held mostly flat on Tuesday before seeing a decline below the 1.2600 handle during the American trading session, slipping to a one-week low and shedding a third of a percent on Tuesday.
Broader markets are seeing a favorable bid for the US Dollar (USD), with the Greenback climbing against most of the major currencies on Tuesday.
US data came in mixed, complicating market flows but keeping the US Dollar bid through the American trading session.
The Institute for Supply Management's (ISM) Services Purchasing Managers' Index (PMI) for November showed a slight uptick in outlook, printing at 52.7 compared to the forecast of 52, and climbing over the previous month's reading of 51.8.
US data mixes, markets keep US Dollar bid
The US JOLTS Job Openings declined to a two-and-a-half-year low of 8.733 million in October, down from the previous month's 9.35 million (revised down from 9.553 million). The US job market remains tight, despite a rapid rate hike cycle, and employment slack continues to remain elusive, weighing on investor expectations of Federal Reserve (Fed) rate cuts in the coming quarters.
The US Dollar is set to be the main driver through the mid-week, with Wednesday bringing the latest ADP Employment Change report for November, forecast to show an uptick from the previous month from 113K to 130K.
The Bank of England (BoE) will also be dropping their latest Financial Stability Report early Wednesday, which will give investors an eye into how far the BoE is leaning into hawkish or dovish territory.
GBP/USD Technical Outlook
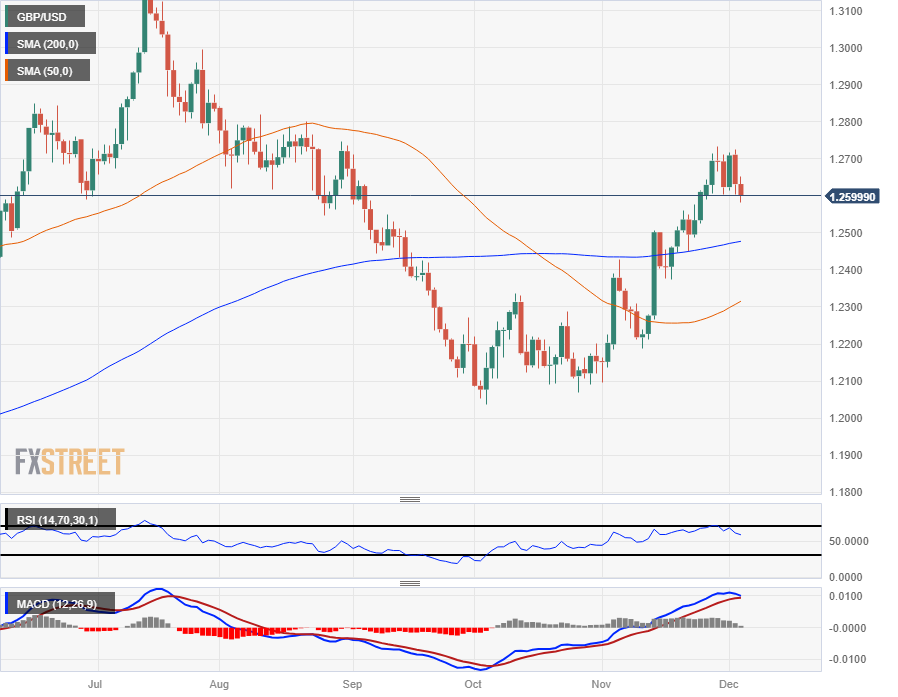
The GBP/USD's decline below 1.2600 sees the pair slipping out of recent consolidation, and setting the pair up for a further decline towards the 200-day Simple Moving Average (SMA) below 1.2500.
The near-term cap on upside momentum remains the upper bound of recent consolidation near 1.2700, and bearish pullbacks will meet a bullish 50-day SMA currently rising from 1.2300.
The GBP/USD has lifted nearly six percent from October's lows near 1.2040, but the bullish momentum could be wrapping up as the pair sees an extended struggle to chalk in further gains on the chart paper.
GBP/USD Daily Chart
GBP/USD Technical Levels
Author

Joshua Gibson
FXStreet
Joshua joins the FXStreet team as an Economics and Finance double major from Vancouver Island University with twelve years' experience as an independent trader focusing on technical analysis.
















