GBP/USD slide continues on US debt-ceiling woes, UK's weak business activity
- GBP/USD fell further due to uncertainty surrounding US debt-ceiling negotiations and mixed US economic data, with investors flocking to the perceived safety of the US Dollar.
- Despite discussions between President Biden and House Speaker McCarthy, US debt-ceiling deadlock persists; Treasury Secretary Yellen warns of cash crunch by June 1.
- Final readings of the S&P Global PMIs for May reveal contrasting trends; New Home Sales record a 13-month high despite a gloomy sentiment on Wall Street.

GBP/USD drops extending its losses past the 20-day Exponential Moving Average (EMA), as a risk-off impulse triggered a flight to safety, favoring the US Dollar (USD) to the detriment of the Pound Sterling (GBP). Uncertainty about the debt-ceiling negotiations in the United States (US), and mixed US economic data bolstered the US Dollar. The GBP/USD is trading at 1.2414, below its opening price by almost 0.20%.
GBP/USD dips below 20-day EMA amid US debt-ceiling disarray, mixed data, and risk-off impulse
The prevailing mood on Wall Street is decidedly gloomy as stocks tread downward. Ongoing debates concerning the increase of the US debt ceiling are eclipsing the latest economic figures from the United States. Even though President Joe Biden and House Speaker Kevin McCarthy declared their Monday discussions productive, they are yet to resolve. Meanwhile, Treasury Secretary Janet Yellen emphasizes the imminent cash crunch in the US, anticipated by June 1.
Amid these circumstances, yields on US Treasury bonds have seen an uptick. The yield on the 10-year bond has risen to 3.726%, bolstering the greenback. The US Dollar Index (DXY), a gauge of the buck’s value against a basket of six currencies, advances 0.33%, up at 103.564.
On the data front, the final readings of the S&P Global PMIs for May were revealed. The Manufacturing Index took a steep fall, hitting 48.5, disappointing forecasts, and falling short of the previous reading above 50. In contrast, the Services Index climbed to 55.1. Consequently, the Composite Index settled at 54.5, pulled up by the buoyant services sector.
New Home Sales have soared to their highest level in 13 months, having grown by 4.1% or 683K units in April. According to the US Commerce Department, this is the most significant increase recorded since March 2022. Given these indications of a revival in the US housing market, Federal Reserve (Fed) officials’ divergent views on adjusting or maintaining rates at the forthcoming June meeting will be interesting.
Recently, there has been a steep drop in the Richmond Fed’s Manufacturing and Services Index readings. Manufacturing is currently at -15, lower than the predicted -8, whereas Services have shown some improvement, increasing to -10 from April’s -29.
Across the pond, the United Kingdom (UK) calendar featured the S&P Global PMIs for May, which showed that business activity came beneath expectations, weighing on the GBP/USD, sending the Sterling towards a new one-month low of 1.2373. That happened despite the International Monetary Fund (IMF) improving the economic outlook of the UK, saying that it no longer expects a recession in the country.
Bank of England (BoE) policymakers led by Governor Andrew Baily appeared before the parliament. Bailey said that “I can’t tell you whether we’re near to the peak, I can’t tell you whether we are at the peak. I think we are nearer to the peak than we were,” as GBP/USD traders brace for Wednesday’s release of the UK’s Consumer Price Index (CPI).
GBP/USD Price Analysis: Technical outlook
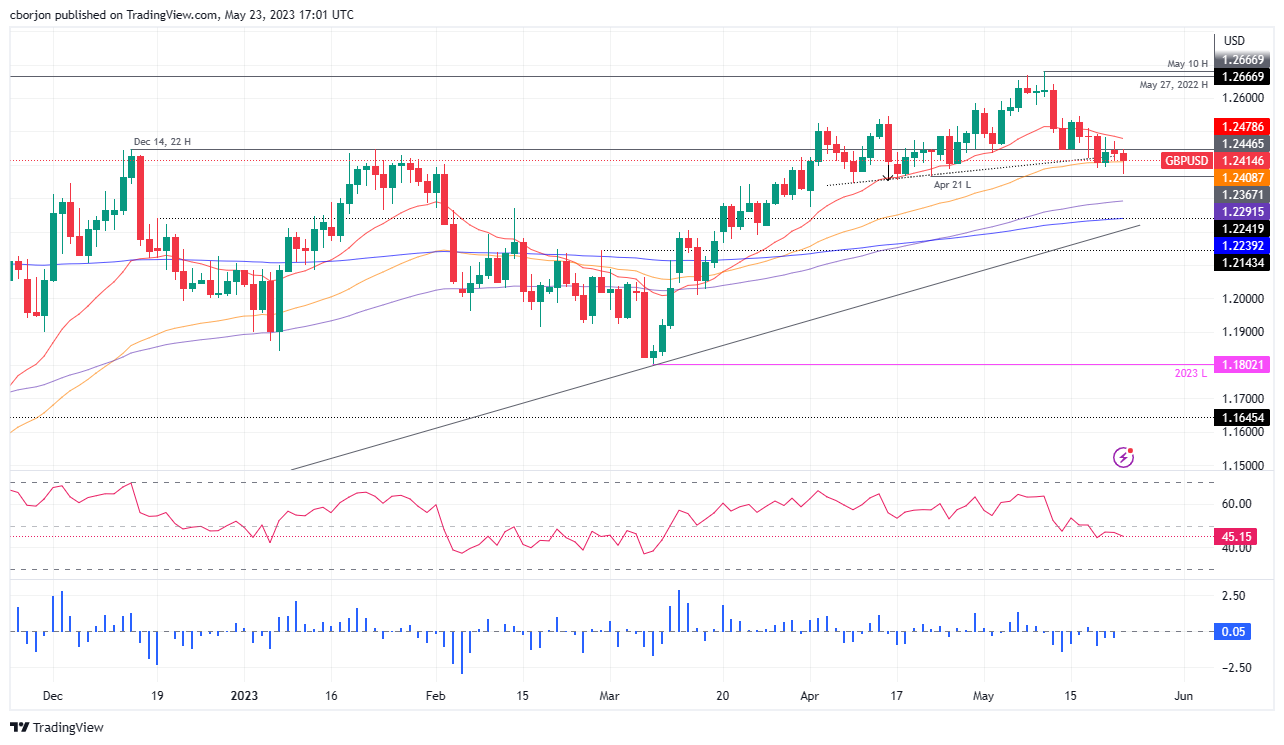
After dropping to a fresh one-month low of 1.2373, Cable has recovered some ground above the 1.2400 figure, claiming on its way north of the 50-day Exponential Moving Average (EMA) at 1.2408. Nevertheless, the GBP/USD failed to rally toward the 20-day EMA at 1.2478, exposing the pair to sellers. The Relative Strength Index (RSI) indicator shifted bearish, suggesting that further downward action is expected. A breach below the 50-day EMA will pave the way to 1.2400. Once broken, the GBP/USD can fall toward the 1.2300 figure before testing the 100-day EMA At 1.2291. Conversely, if GBP/USD rallies past the 20-day EMA, it could challenge the 1.2500 figure.
Author

Christian Borjon Valencia
FXStreet
Markets analyst, news editor, and trading instructor with over 14 years of experience across FX, commodities, US equity indices, and global macro markets.


