GBP/USD sinks from weekly high as risk aversion takes hold
- US Consumer Confidence continued deteriorating as Americans became more “pessimistic” about the economic outlook.
- Federal Reserve Regional Manufacturing and Services Indices show mixed readings, though flashing a deceleration in the US economy.
- BoE Chief Economist says Brits need to accept they’re “poorer”; calls for higher rates to tackle inflation.

GBP/USD reverses its earlier course after hitting a weekly high of 1.2507 and drops towards the 1.2400 figure amidst a risk-off impulse that triggered flows towards safe-haven assets. Therefore, the US Dollar (USD) remains in the driver’s seat, although US Treasury bond yields are collapsing. The GBP/USD is trading at 1.2401, down 0.67%.
US Consumer Confidence Drops, Fed’s Manufacturing and Services Indices Decelerate, BoE Chief Economist Urges Higher Rates
Sentiment remains deteriorating as the latest tranche of economic data from the United States (US) increased investors’ worries. Consumer Confidence in the United States dipped to its lowest level since July at 101.3, vs. estimates of 104.0. “Consumers became more pessimistic about the outlook for both business conditions and labor markets,” said Ataman Ozyildirim, senior director of economics at the Conference Board.
Further data, like the Philadelphia Fed Non-Manufacturing Activity plunging to -22.8, sparked recessionary fears. Of late, the Dallas Fed revealed the Services Activity Index for April, showing a slight improvement, to -14.4 vs. -18.8 in March, after yesterday’s report showed that the Manufacturing Index plunged to -23.4, as business conditions worsened.
Other data revealed that New Home Sales for March rose by 9.6%, exceeding 1.1% estimates, as increasing speculation that the Federal Reserve will pause its tightening cycle has kept mortgage rates stable.
Given the backdrop, the GBP/USD extended its losses due to risk aversion, even though US Treasury bond yields are plunging. Conversely, the greenback is rising 0.48%, as shown by the US Dollar Index at 101.815.
Across the pond, the UK agenda revealed the CBI Industrial Trend Order, which stood at -20, neither improving nor worsening, though flashed that the economy is stagnating. Meanwhile, the Bank of England (BoE) Governor Ben Broadbent commented that there’s no evidence that QE sparked the jump in inflation.
Of late, the BoE Chief Economist Huw Pill commented that British people need to accept that they are “poorer.” Pill added that recent events call for higher rates and foresees UK’s inflation would dip to 2% in two years.
GBP/USD Technical Analysis
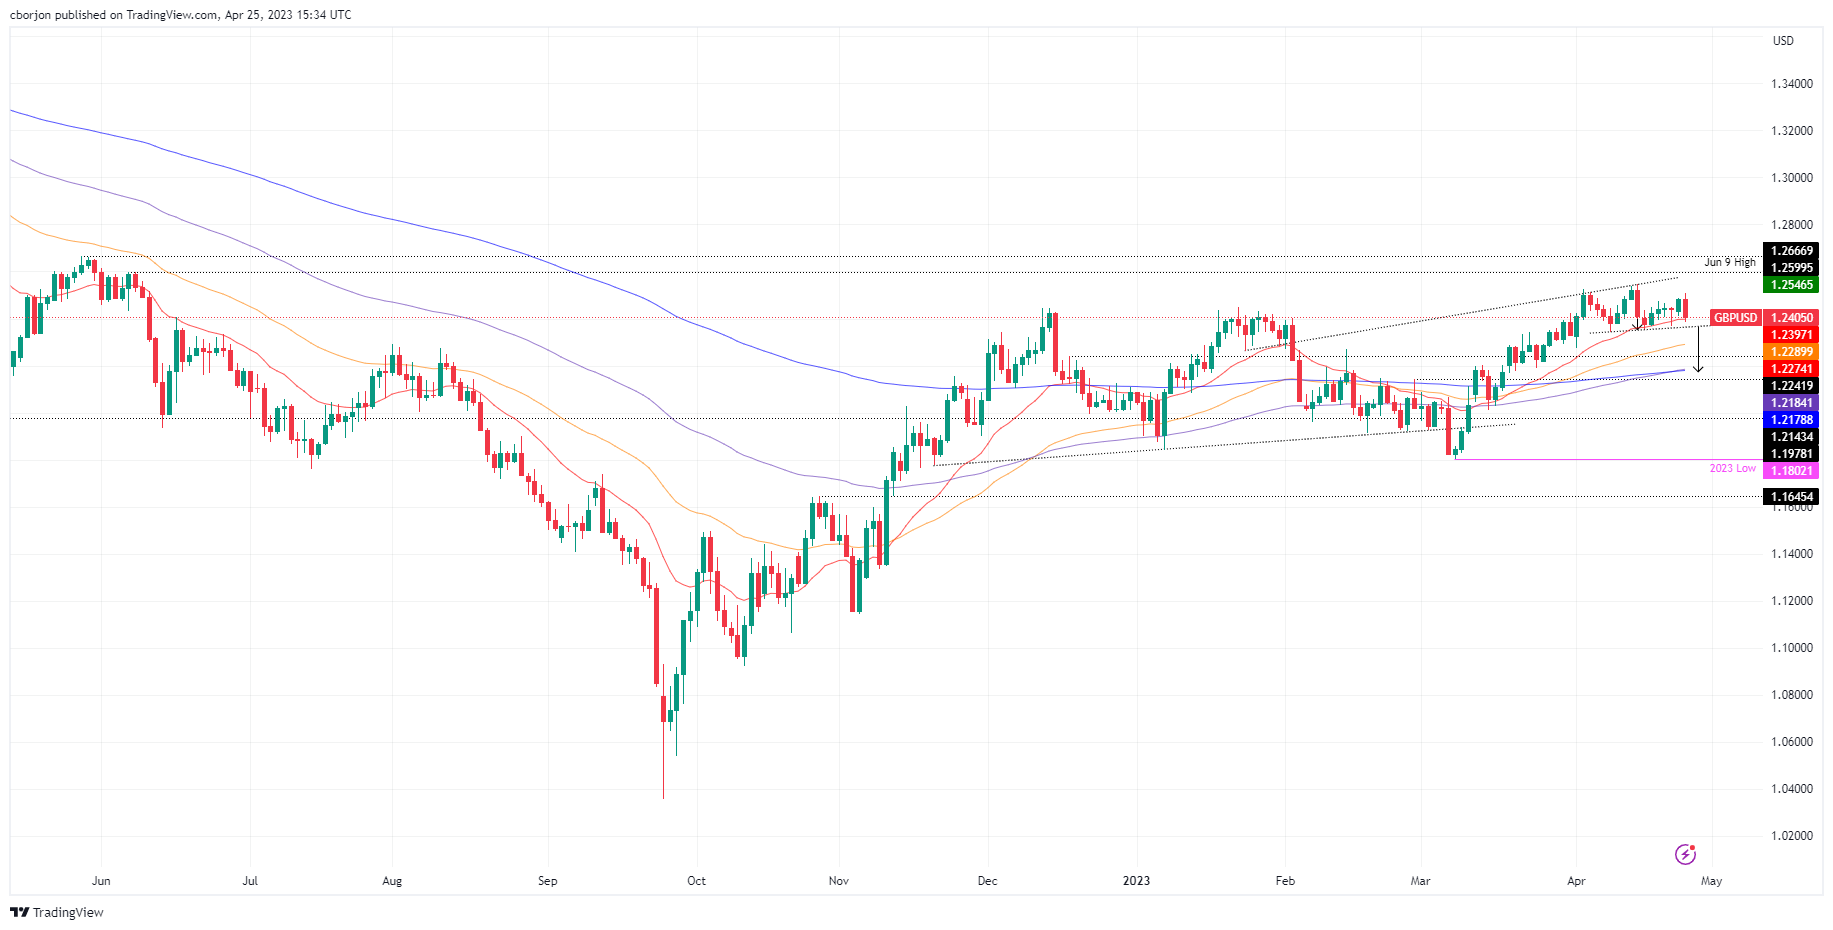
From a technical perspective, the GBP/USD appears to have formed a head-and-shoulders chart pattern that could drive prices to test the confluence of the 100 and 200-day EMAs at around 1.2170. But firstly, the GBP/USD must break below the head-and-shoulders neckline at approximately 1.2360/70, so it could confirm its validity. If that scenario plays out, the GBP/USD next support would be the 50-day EMA at 1.2289 and then the 1.2200 figure. Conversely, if GBP/USD stays above 1.2400, it could pave the way for a bullish continuation towards 1.2500.
Author

Christian Borjon Valencia
FXStreet
Markets analyst, news editor, and trading instructor with over 14 years of experience across FX, commodities, US equity indices, and global macro markets.
















