GBP/USD Price Analysis: Under pressure between 21-day SMA and 50% Fibonacci


Share:
  • GBP/USD remains below 50% Fibonacci retracement for two weeks in a row.
  • An ascending trend line since early-November acts as strong support.
  • An upside break beyond Wednesday’s high could challenge the monthly top.

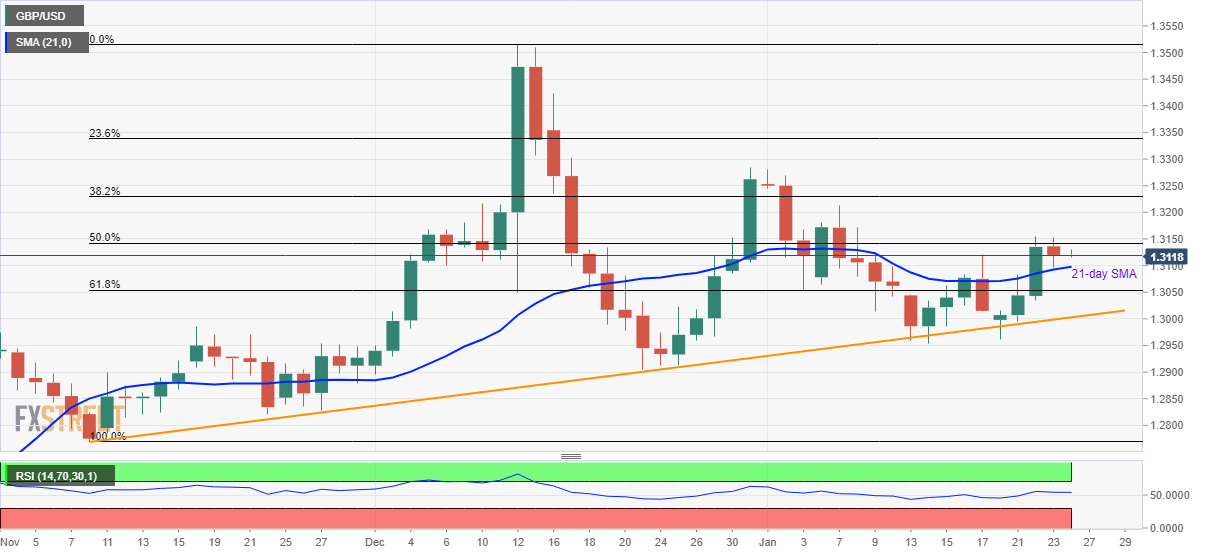
GBP/USD remains mildly negative while trading near 1.3120 during the Asian session on Friday. The pair took a U-turn from 50% Fibonacci retracement of its November-December 2019 upside on the previous day. Even so, prices carry the 21-day SMA breakout registered on Wednesday.

Hence, a daily closing beyond the 45-pip range between 1.3145 and 1.3100, including 50% Fibonacci retracement and 21-day SMA respectively, becomes necessary for the pair to register increased volatility.

61.8% Fibonacci retracement at 1.3054 and an upward sloping trend line stretched since early November at 1.3000 now, can question the sellers during the pair’s downside below 1.3100.

Should there be increased selling under 1.3000 mark, December monthly low near 1.2900 will lure the bears.

Alternatively, the monthly high surrounding 1.3285 will be the buyers’ choice if prices manage to cross 1.3145. Further, 23.6% Fibonacci retracement and December month top, near 1.3340 and 1.3515, will be in focus during the pair’s rise after 1.3285.

GBP/USD daily chart

Trend: Sideways

Additional important levels

Overview
Today last price 1.3119
Today Daily Change -1 pip
Today Daily Change % -0.01%
Today daily open 1.312
 
Trends
Daily SMA20 1.3092
Daily SMA50 1.3053
Daily SMA100 1.2831
Daily SMA200 1.2691
 
Levels
Previous Daily High 1.3152
Previous Daily Low 1.3097
Previous Weekly High 1.312
Previous Weekly Low 1.2954
Previous Monthly High 1.3515
Previous Monthly Low 1.2896
Daily Fibonacci 38.2% 1.3118
Daily Fibonacci 61.8% 1.3131
Daily Pivot Point S1 1.3094
Daily Pivot Point S2 1.3068
Daily Pivot Point S3 1.3039
Daily Pivot Point R1 1.3149
Daily Pivot Point R2 1.3178
Daily Pivot Point R3 1.3204


Share: Feed news

Information on these pages contains forward-looking statements that involve risks and uncertainties. Markets and instruments profiled on this page are for informational purposes only and should not in any way come across as a recommendation to buy or sell in these assets. You should do your own thorough research before making any investment decisions. FXStreet does not in any way guarantee that this information is free from mistakes, errors, or material misstatements. It also does not guarantee that this information is of a timely nature. Investing in Open Markets involves a great deal of risk, including the loss of all or a portion of your investment, as well as emotional distress. All risks, losses and costs associated with investing, including total loss of principal, are your responsibility. The views and opinions expressed in this article are those of the authors and do not necessarily reflect the official policy or position of FXStreet nor its advertisers. The author will not be held responsible for information that is found at the end of links posted on this page.

If not otherwise explicitly mentioned in the body of the article, at the time of writing, the author has no position in any stock mentioned in this article and no business relationship with any company mentioned. The author has not received compensation for writing this article, other than from FXStreet.

FXStreet and the author do not provide personalized recommendations. The author makes no representations as to the accuracy, completeness, or suitability of this information. FXStreet and the author will not be liable for any errors, omissions or any losses, injuries or damages arising from this information and its display or use. Errors and omissions excepted.

The author and FXStreet are not registered investment advisors and nothing in this article is intended to be investment advice.

Follow us on Telegram

Stay updated of all the news

Join Telegram

Recommended content


Follow us on Telegram

Stay updated of all the news

Join Telegram

Recommended content

Editors’ Picks

AUD/USD attracts some buyers above 0.6570 following the Australian GDP data

AUD/USD attracts some buyers above 0.6570 following the Australian GDP data

The AUD/USD pair climbs to 0.6575 during the early Asian trading hours on Wednesday. The pair edges higher following the Australian growth numbers. However, the rebound of the US Dollar and risk-off mood might cap the further upside of AUD/USD.

AUD/USD News

EUR/USD extends the decline below 1.0800, Eurozone Retail Sales eyed

EUR/USD extends the decline below 1.0800, Eurozone Retail Sales eyed

The EUR/USD pair remains under selling pressure below the 1.0800 psychological mark during the early Asian session on Wednesday. The upbeat Eurozone PMI data for November failed to inspire the Euro amid the persistently weak demand in the Eurozone.

EUR/USD News

Gold drops to $2,020, eyed on US ADP data

Gold drops to $2,020, eyed on US ADP data

Gold loses momentum during the early Asian session on Wednesday. The renewed US Dollar demand drag the yellow metal lower. Meanwhile, the US Dollar Index rebounds to 104.00. The XAU/USD price trades near $2020, up 0.01% for the day.

Gold News

Arbitrum price veers as hard fork proposal receives 99.84% votes in favor

Arbitrum price veers as hard fork proposal receives 99.84% votes in favor

Arbitrum's price surpassed expectations as the altcoin managed to restrict the fluctuation over the past 24 hours. This is because ARB was forecasted to rally following the result of the proposal to essentially hard-fork the chain.

Read more

US markets traded in a mixed-bag fashion

US markets traded in a mixed-bag fashion

US markets traded in a mixed-bag fashion, but the tone of the S&P 500 was rather moody, with losers outpacing winners by a wide margin, all as markets digest a stronger-than-expected November ISM Non-manufacturing survey offset by an unexpected significant decline in October job openings.

Read more

Forex MAJORS

Cryptocurrencies

Signatures