|

GBP/USD Price Analysis: Shows some resilience below 1.2200, 50 DMA holds the key for bulls

  • GBP/USD retreats further from a multi-week high set on Thursday amid resurgent USD demand.
  • The technical setup still supports prospects for the emergence of some dip-buying.at lower levels.
  • A sustained weakness below the 50-day SMA is needed to negate the near-term positive outlook.

The GBP/USD pair comes under intense selling pressure on Friday and extends the overnight retracement slide from the vicinity of mid-1.2300s, or its highest level since February. Spot prices, however, manage to rebound a few pips from the daily low and trade above the 1.2200 mark during the early North American session, still down nearly 0.60% for the day.

A fresh wave of the global risk-aversion trade - amid lingering concerns about a full-blown banking crisis - assists the safe-haven US Dollar (USD) to build on the previous day's solid bounce from a seven-week low. Apart from this, the weaker-than-expected release of UK PMI prints for March weighs on the British Pound and further contributes to the heavily offered tone surrounding the GBP/USD pair.

That said, the Federal Reserve's hints of a pause to interest rate hikes, along with the anti-risk flow, lead to a further steep decline in the US Treasury bond yields. Furthermore, the disappointing US Durable Goods Orders act as a headwind for the USD and lend some support to the GBP/USD pair. Spot prices, meanwhile, showed some resilience below the 1.2200 resistance-turned-support.

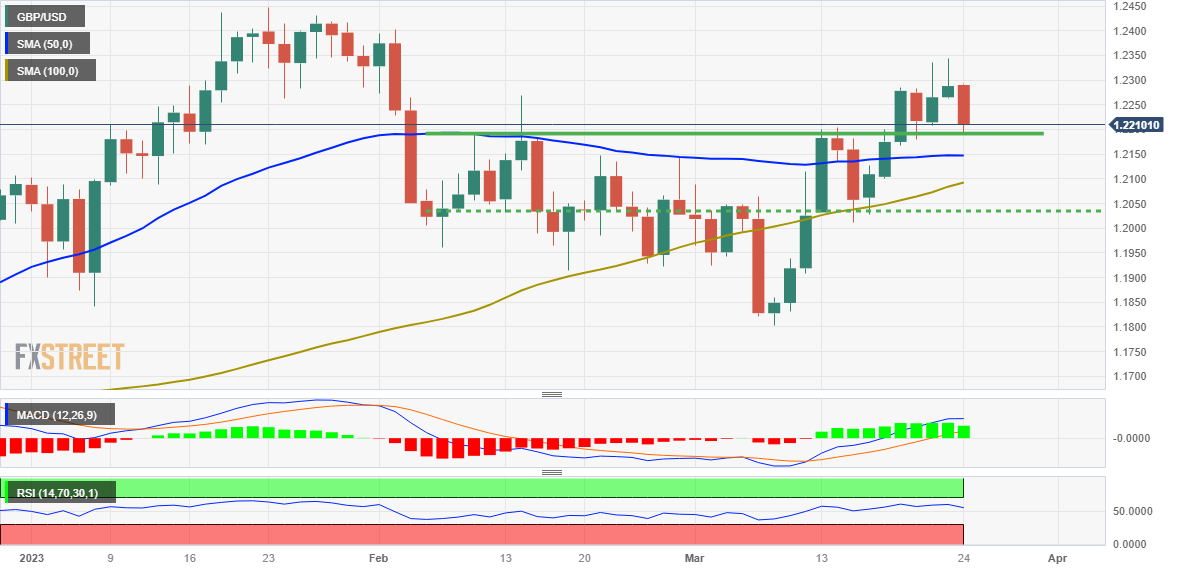
The said handle is followed by the 50-day Simple Moving Average (SMA), currently around the 1.2150-1.2145 region, which if broken decisively might prompt some technical selling and pave the way for deeper losses. The GBP/USD pair might then accelerate the fall towards the 1.2100 mark (100-day SMA) before eventually dropping to the next relevant support near the 1.2040 horizontal zone.

On the flip side, any meaningful recovery now seems to confront an immediate hurdle near the 1.2270-1.2275 region. A sustained move beyond has the potential to push the GBP/USD pair back above the 1.2300 round figure, towards resting the multi-week high, around the 1.2340-1.2345 region touched on Thursday. Bulls might then aim to reclaim the 1.2400 mark and the YTD peak around the 1.2445-1.2450 zone.

GBP/USD daily chart

fxsoriginal

Key levels to watch

GBP/USD

Overview
Today last price1.2217
Today Daily Change-0.0071
Today Daily Change %-0.58
Today daily open1.2288
 
Trends
Daily SMA201.2071
Daily SMA501.2148
Daily SMA1001.2084
Daily SMA2001.1893
 
Levels
Previous Daily High1.2344
Previous Daily Low1.2262
Previous Weekly High1.2204
Previous Weekly Low1.201
Previous Monthly High1.2402
Previous Monthly Low1.1915
Daily Fibonacci 38.2%1.2312
Daily Fibonacci 61.8%1.2293
Daily Pivot Point S11.2252
Daily Pivot Point S21.2216
Daily Pivot Point S31.217
Daily Pivot Point R11.2334
Daily Pivot Point R21.2379
Daily Pivot Point R31.2415

Author

Haresh Menghani

Haresh Menghani is a detail-oriented professional with 10+ years of extensive experience in analysing the global financial markets.

More from Haresh Menghani
Share:

Markets move fast. We move first.

Orange Juice Newsletter brings you expert driven insights - not headlines. Every day on your inbox.

By subscribing you agree to our Terms and conditions.

Editor's Picks

EUR/USD drops to daily lows near 1.1630

EUR/USD now loses some traction and slips back to the area of daily lows around 1.1630 on the back of a mild bounce in the US Dollar. Fresh US data, including the September PCE inflation numbers and the latest read on December consumer sentiment, didn’t really move the needle, so the pair is still on course to finish the week with a respectable gain.

GBP/USD trims gains, recedes toward 1.3320

GBP/USD is struggling to keep its daily advance, coming under fresh pressure and retreating to the 1.3320 zone following a mild bullish attempt in the Greenback. Even though US consumer sentiment surprised to the upside, the US Dollar isn’t getting much love, as traders are far more interested in what the Fed will say next week.

Gold makes a U-turn, back to $4,200

Gold is now losing the grip and receding to the key $4,200 region per troy ounce following some signs of life in the Greenback and a marked bounce in US Treasury yields across the board. The positive outlook for the precious metal, however, remains underpinned by steady bets for extra easing by the Fed.

Crypto Today: Bitcoin, Ethereum, XRP pare gains despite increasing hopes of upcoming Fed rate cut

Bitcoin is steadying above $91,000 at the time of writing on Friday. Ethereum remains above $3,100, reflecting positive sentiment ahead of the Federal Reserve's (Fed) monetary policy meeting on December 10.

Week ahead – Rate cut or market shock? The Fed decides

Fed rate cut widely expected; dot plot and overall meeting rhetoric also matter. Risk appetite is supported by Fed rate cut expectations; cryptos show signs of life. RBA, BoC and SNB also meet; chances of surprises are relatively low.

Ripple faces persistent bear risks, shrugging off ETF inflows

Ripple is extending its decline for the second consecutive day, trading at $2.06 at the time of writing on Friday. Sentiment surrounding the cross-border remittance token continues to lag despite steady inflows into XRP spot ETFs.