GBP/USD Price Analysis: Sellers attack 1.2260 hurdle on fresh Brexit woes


  • GBP/USD extends pullback from one-week high as NIP Bill passes the UK’s House of Commons vote.
  • Convergence of 50-SMA, two-week-old ascending trend line restricts immediate downside.
  • RSI retreat, pullback from 100-SMA adds strength to the bearish bias.
  • 200-SMA adds to the upside filters, sellers can aim for fresh monthly low.

GBP/USD remains pressured around 1.2260 as bears jostle with the short-term key supports following the fresh Brexit news during late Monday, early Tuesday for Asia.

That said, the UK’s House of Commons had enough votes to pass the controversial Northern Ireland Protocol (NIP) even as the European Union (EU) warned of trade wars if the British policymakers progress with the actions.

Read: Northern Ireland Protocol (NIP) Bill passes UK House of Commons vote

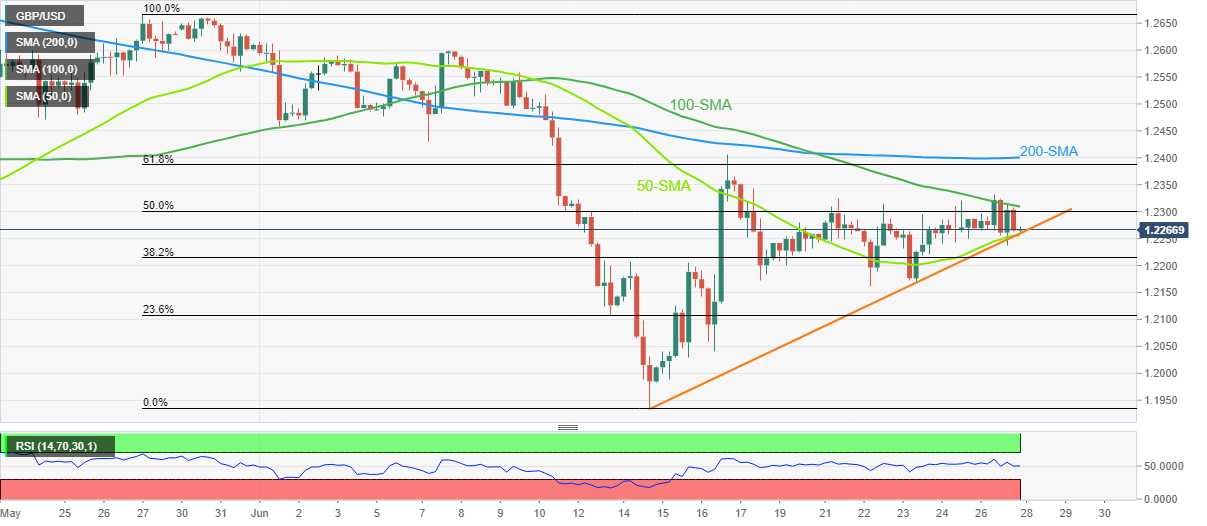
Technically, the cable pair keeps the previous day’s pullback from the 100-SMA towards challenging a convergence of the 50-SMA and a fortnight-long support line, near 1.2255 by the press time.

Given the RSI (14) retreats and the failure to cross key SMA, not to forget Brexit news, the GBP/USD prices are likely to break the immediate support.

Following that, the 1.2200 round figure and 23.6% Fibonacci retracement (Fibo.) of May 27 to June 14 downside, near 1.2108, could probe the bears on their way to refresh the monthly low, currently around 1.1935.

Meanwhile, the 100-SMA level near 1.2310 guards the immediate recovery of the GBP/USD pair ahead of the 61.8% Fibonacci retracement level near 1.2390.

In a case where the Cable pair rises past 1.2390, the 200-SMA level of 1.2400 could act as the last defense of the bears.

GBP/USD: Four-hour chart

Trend: Further weakness expected

Additional important levels

Overview
Today last price 1.2262
Today Daily Change -0.0007
Today Daily Change % -0.06%
Today daily open 1.2269
 
Trends
Daily SMA20 1.2375
Daily SMA50 1.2482
Daily SMA100 1.2872
Daily SMA200 1.3191
 
Levels
Previous Daily High 1.232
Previous Daily Low 1.2241
Previous Weekly High 1.2324
Previous Weekly Low 1.2161
Previous Monthly High 1.2667
Previous Monthly Low 1.2155
Daily Fibonacci 38.2% 1.229
Daily Fibonacci 61.8% 1.2271
Daily Pivot Point S1 1.2233
Daily Pivot Point S2 1.2197
Daily Pivot Point S3 1.2154
Daily Pivot Point R1 1.2313
Daily Pivot Point R2 1.2357
Daily Pivot Point R3 1.2393


Share: Feed news

Information on these pages contains forward-looking statements that involve risks and uncertainties. Markets and instruments profiled on this page are for informational purposes only and should not in any way come across as a recommendation to buy or sell in these assets. You should do your own thorough research before making any investment decisions. FXStreet does not in any way guarantee that this information is free from mistakes, errors, or material misstatements. It also does not guarantee that this information is of a timely nature. Investing in Open Markets involves a great deal of risk, including the loss of all or a portion of your investment, as well as emotional distress. All risks, losses and costs associated with investing, including total loss of principal, are your responsibility. The views and opinions expressed in this article are those of the authors and do not necessarily reflect the official policy or position of FXStreet nor its advertisers. The author will not be held responsible for information that is found at the end of links posted on this page.

If not otherwise explicitly mentioned in the body of the article, at the time of writing, the author has no position in any stock mentioned in this article and no business relationship with any company mentioned. The author has not received compensation for writing this article, other than from FXStreet.

FXStreet and the author do not provide personalized recommendations. The author makes no representations as to the accuracy, completeness, or suitability of this information. FXStreet and the author will not be liable for any errors, omissions or any losses, injuries or damages arising from this information and its display or use. Errors and omissions excepted.

The author and FXStreet are not registered investment advisors and nothing in this article is intended to be investment advice.

Recommended content


Recommended content

Editors’ Picks

EUR/USD clings to daily gains above 1.0650

EUR/USD clings to daily gains above 1.0650

EUR/USD gained traction and turned positive on the day above 1.0650. The improvement seen in risk mood following the earlier flight to safety weighs on the US Dollar ahead of the weekend and helps the pair push higher.

EUR/USD News

GBP/USD recovers toward 1.2450 after UK Retail Sales data

GBP/USD recovers toward 1.2450 after UK Retail Sales data

GBP/USD reversed its direction and advanced to the 1.2450 area after touching a fresh multi-month low below 1.2400 in the Asian session. The positive shift seen in risk mood on easing fears over a deepening Iran-Israel conflict supports the pair.

GBP/USD News

Gold holds steady at around $2,380 following earlier spike

Gold holds steady at around $2,380 following earlier spike

Gold stabilized near $2,380 after spiking above $2,400 with the immediate reaction to reports of Israel striking Iran. Meanwhile, the pullback seen in the US Treasury bond yields helps XAU/USD hold its ground.

Gold News

Bitcoin Weekly Forecast: BTC post-halving rally could be partially priced in Premium

Bitcoin Weekly Forecast: BTC post-halving rally could be partially priced in

Bitcoin price shows no signs of directional bias while it holds above  $60,000. The fourth BTC halving is partially priced in, according to Deutsche Bank’s research. 

Read more

Week ahead – US GDP and BoJ decision on top of next week’s agenda

Week ahead – US GDP and BoJ decision on top of next week’s agenda

US GDP, core PCE and PMIs the next tests for the Dollar. Investors await BoJ for guidance about next rate hike. EU and UK PMIs, as well as Australian CPIs also on tap.

Read more

Forex MAJORS

Cryptocurrencies

Signatures