|

GBP/USD Price Analysis: Retreats to mid-1.3700s, back closer to ascending channel support

  • GBP/USD surrendered a major part of its intraday gains to the 1.3800 neighbourhood.
  • Elevated US bond yields underpinned the USD and exerted some pressure on the pair.
  • A break below ascending channel support is needed to confirm a fresh bearish break.

The GBP/USD pair struggled to preserve its intraday gains to the 1.3800 neighbourhood and has now retreated to the lower end of its daily trading range. The pair was last seen hovering around mid-1.3700s, just a few pips above lows touched during the Asian session.

The US dollar attracted some buying amid elevated US Treasury bond yields, bolstered by expectations for an early policy tightening by the Fed. This, in turn, was seen as a key factor that prompted fresh selling around the GBP/USD pair and led to the intraday decline.

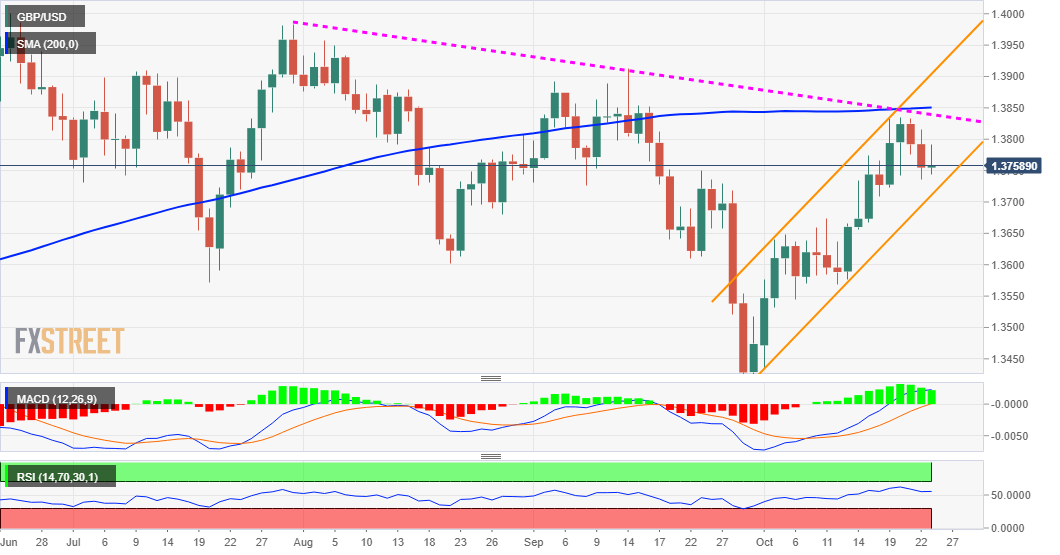
The downfall dragged the GBP/USD pair back towards key pivotal support marked by the lower boundary of a one-month-old descending channel. A convincing break below will set the stage for an extension of the recent rejection slide from the very important 200-day SMA.

Meanwhile, technical indicators on the daily chart – though have been losing positive traction – are still holding in the bullish territory. This makes it prudent to wait for a convincing break through the channel support before placing aggressive bearish bets.

The mentioned support is currently pegged near the 1.3735 region. Some follow-through selling below the 1.3700 mark will reaffirm the negative outlook and turn the GBP/USD pair vulnerable to accelerate the fall towards the next relevant support near mid-1.3600s.

On the flip side, the 1.3790-1.3800 area now seems to have emerged as immediate strong resistance. This is followed by a downward sloping trend-line resistance extending from late July, currently around the 1.3825 region ahead of the 1.3845-50 confluence barrier.

The latter comprises of 200-day SMA and the top end of the ascending channel, which if cleared decisively will be seen as a fresh trigger for bullish traders. The momentum could then assist the GBP/USD pair to aim back to reclaim the 1.3900 round-figure mark.

GBP/USD daily chart

fxsoriginal

Technical levels to watch

GBP/USD

Overview
Today last price1.3757
Today Daily Change0.0002
Today Daily Change %0.01
Today daily open1.3755
 
Trends
Daily SMA201.3645
Daily SMA501.3712
Daily SMA1001.38
Daily SMA2001.385
 
Levels
Previous Daily High1.3815
Previous Daily Low1.3736
Previous Weekly High1.3834
Previous Weekly Low1.3709
Previous Monthly High1.3913
Previous Monthly Low1.3412
Daily Fibonacci 38.2%1.3766
Daily Fibonacci 61.8%1.3785
Daily Pivot Point S11.3722
Daily Pivot Point S21.369
Daily Pivot Point S31.3644
Daily Pivot Point R11.3801
Daily Pivot Point R21.3848
Daily Pivot Point R31.388

Author

Haresh Menghani

Haresh Menghani is a detail-oriented professional with 10+ years of extensive experience in analysing the global financial markets.

More from Haresh Menghani
Share:

Markets move fast. We move first.

Orange Juice Newsletter brings you expert driven insights - not headlines. Every day on your inbox.

By subscribing you agree to our Terms and conditions.

Editor's Picks

EUR/USD holds steady near 1.1750 on first trading day of 2026

EUR/USD stays calm on Friday and trades in a narrow channel at around 1.1750 as trading conditions remain thin following the New Year holiday and ahead of the weekend. The economic calendar will not feature any high-impact data releases.

GBP/USD struggles to gain traction, stabilizes above 1.3450

After testing 1.3400 on the last day of 2025, GBP/USD managed to stage a rebound. Nevertheless, the pair finds it difficult to gather momentum and moves sideways above 1.3450 as market participants remain in holiday mood.

Gold climbs toward $4,400 following deep correction

Gold reverses its direction and advances toward $4,400 after suffering heavy losses amid profit-taking before the New Year holiday. Growing expectations for a dovish Fed policy and persistent geopolitical risks seem to be helping XAU/USD stretch higher.

Cardano gains early New Year momentum, bulls target falling wedge breakout

Cardano kicks off the New Year on a positive note and is extending gains, trading above $0.36 at the time of writing on Friday. Improving on-chain and derivatives data point to growing bullish interest, while the technical outlook keeps an upside breakout in focus.

Economic outlook 2026-2027 in advanced countries: Solidity test

After a year marked by global economic resilience and ending on a note of optimism, 2026 looks promising and could be a year of solid economic performance. In our baseline scenario, we expect most of the supportive factors at work in 2025 to continue to play a role in 2026.

Crypto market outlook for 2026

Year 2025 was volatile, as crypto often is.  Among positive catalysts were favourable regulatory changes in the U.S., rise of Digital Asset Treasuries (DAT), adoption of AI and tokenization of Real-World-Assets (RWA).