|
GBP/USD Price Analysis: Pound reverses up from multi-week lows, bulls eyeing 1.3180 level
- GBP/USD is rebounding from multi-week lows and challenges the 200 SMA on the four-hour chart.
- The levels to beat for buyers is the 1.3082 level.

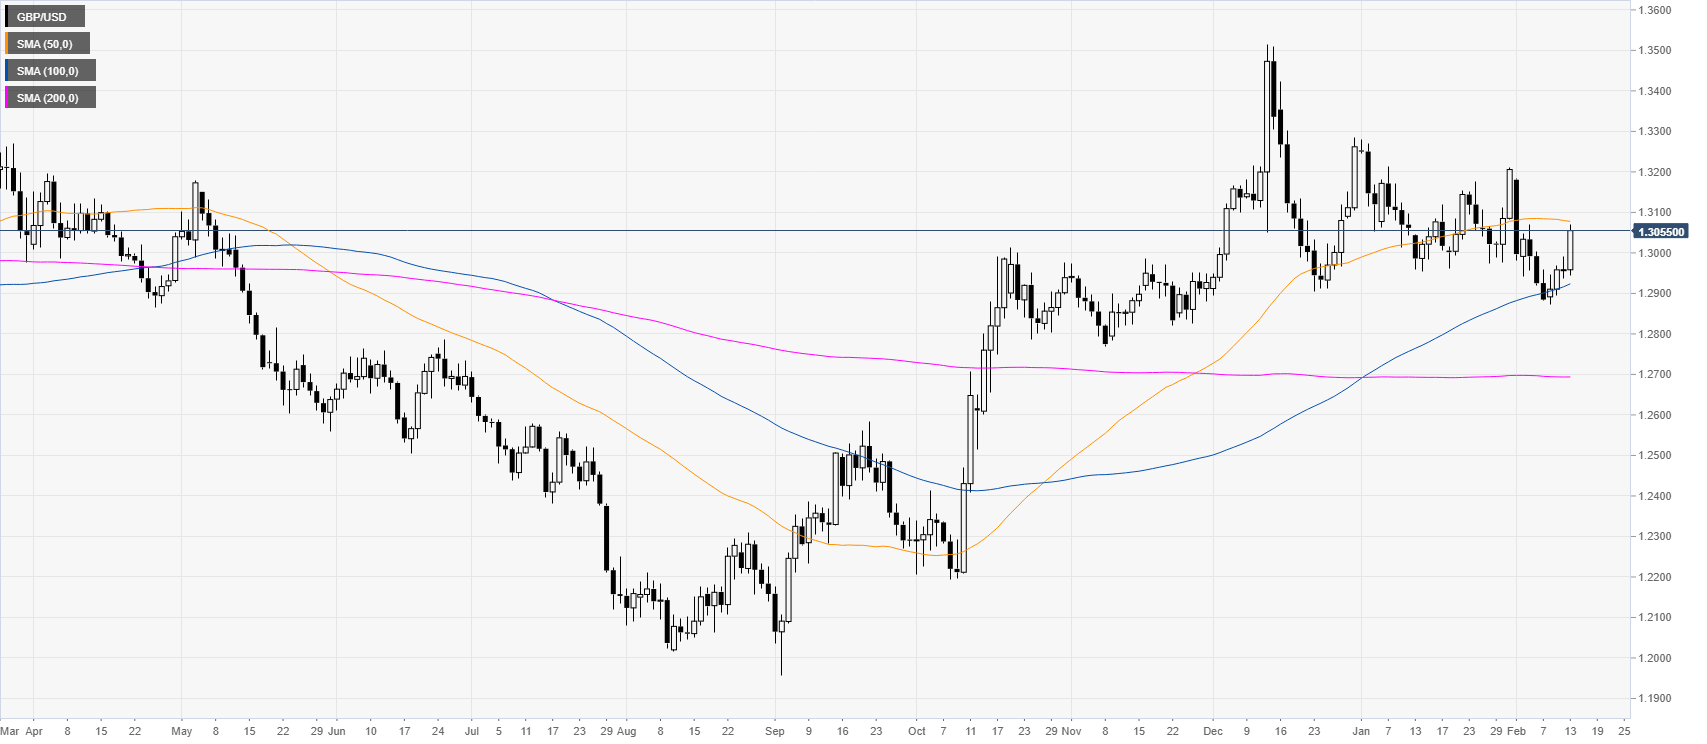
GBP/USD daily chart
After the October and December bull-market, the pound is trading in a rectangle consolidation above the 100/200-day simple moving averages (SMAs). The spot is nearing the 1.3100 figure and the 50 SMA.
GBP/USD four-hour chart
The pound is bouncing from multi-week lows as the spot is challenging the 200 SMA on the four-hour chart. As buyers are back in control the spot will likely attempt to break above the 1.3082 resistance to reach higher levels near the 1.3155/80 resistance zone. Support is seen near the 1.3020 and 1.2987 price levels, according to the Technical Confluences Indicator.
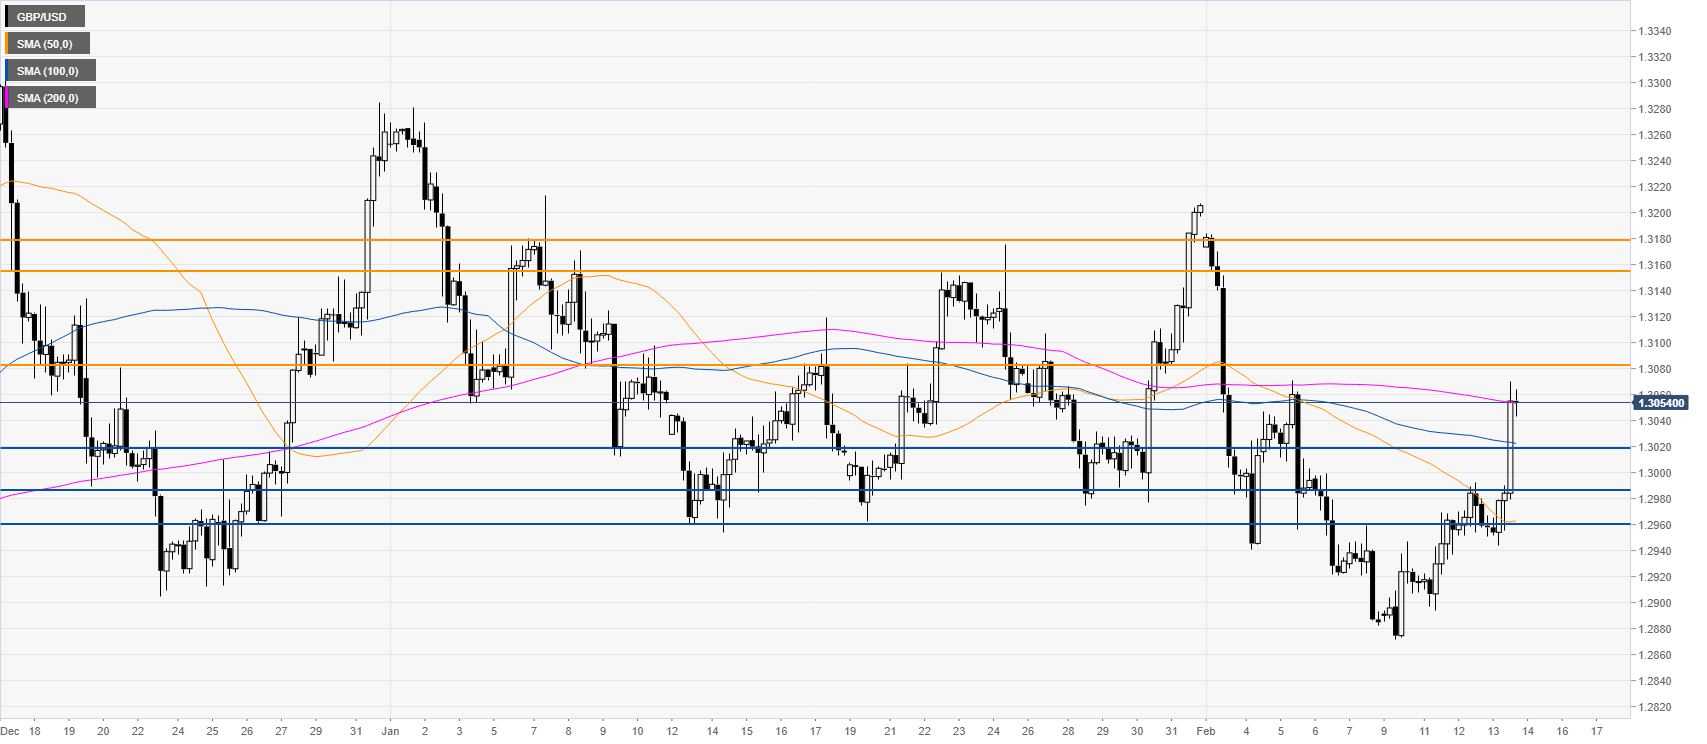
Resistance: 1.3082, 1.3155, 1.3180
Support: 1.3020, 1.2987, 1.2960
Additional key levels
Author

Flavio Tosti
Independent Analyst
More from Flavio Tosti


