|

GBP/USD Price Analysis: On the front foot towards 1.3115/20 resistance confluence

  • GBP/USD registers a five-day winning streak.
  • A confluence of 50% Fibonacci retracement and the descending trend line from December 31, 2019, becomes the key.
  • 50 and 100-day SMAs can offer immediate supports during the pullback.

Despite slipping back from the intra-day high of 1.3105, GBP/USD stays positive while taking rounds to 1.3095 during the Asian session on Monday.

Not only its ability to cross a downward sloping trend line since December 12, 2019, but a sustained run-up beyond 50 and 100-day SMAs also portrays the underlying strength in momentum.

That said, GBP/USD prices are now rising towards a confluence of 50% Fibonacci retracement of its declines from December 2019 to February 2020 as well as a falling trend line from December 31, 2019, around 1.3115/20.

Should the bulls manage to keep the reins past-1.3120, January-end high close to 1.3210 as well as 61.8% Fibonacci retracement near 1.3215 will be important to watch.

On the contrary, 38.2% Fibonacci retracement near 1.3030 can act as the closest support in a case of the pair’s pullback.

Though 50-day and 100-day SMAs, respectively near 1.3010 and 1.2995, can question the pair’s further declines below 1.3030, if not then the broader support line around 1.2985 will be on the bears’ radars.

GBP/USD daily chart
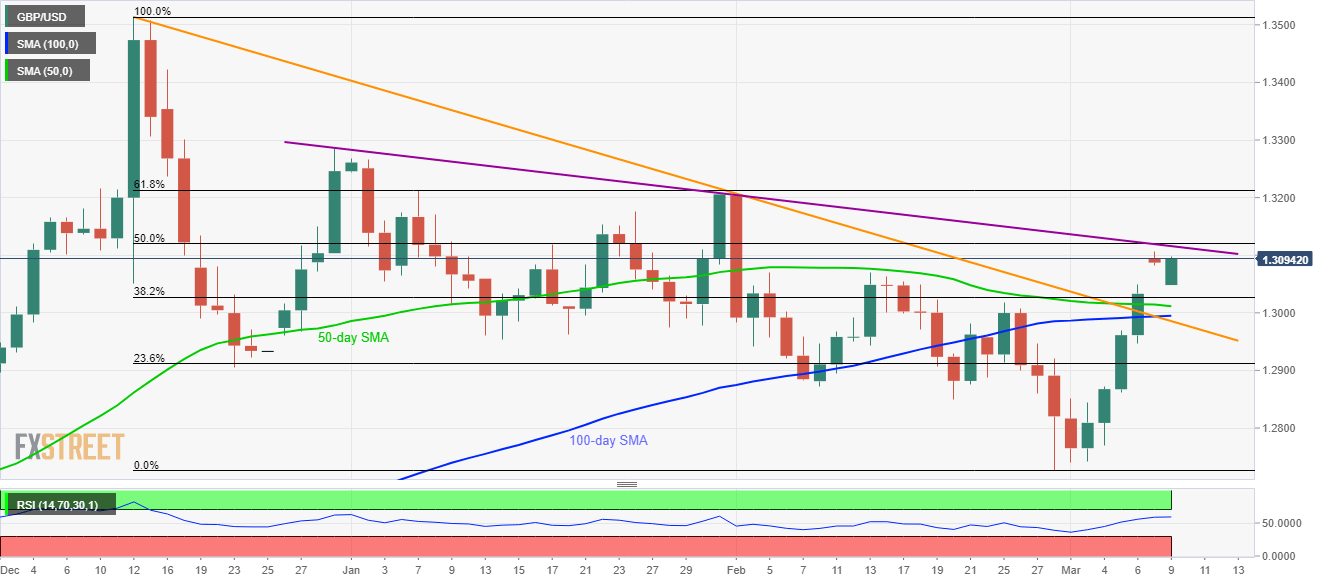
Trend: Bullish

Additional important levels

Overview
Today last price1.309
Today Daily Change0.0057
Today Daily Change %0.44%
Today daily open1.3033
 
Trends
Daily SMA201.2934
Daily SMA501.3015
Daily SMA1001.2992
Daily SMA2001.2707
 
Levels
Previous Daily High1.3049
Previous Daily Low1.2946
Previous Weekly High1.3049
Previous Weekly Low1.2741
Previous Monthly High1.3204
Previous Monthly Low1.2726
Daily Fibonacci 38.2%1.301
Daily Fibonacci 61.8%1.2986
Daily Pivot Point S11.297
Daily Pivot Point S21.2906
Daily Pivot Point S31.2866
Daily Pivot Point R11.3073
Daily Pivot Point R21.3113
Daily Pivot Point R31.3176

Author

Anil Panchal

Anil Panchal

FXStreet

Anil Panchal has nearly 15 years of experience in tracking financial markets. With a keen interest in macroeconomics, Anil aptly tracks global news/updates and stays well-informed about the global financial moves and their implications.


More from Anil Panchal
Share:

Editor's Picks

AUD/USD climbs toward 0.7000 after strong China data dump

AUD/USD attracts follow-through buyers for the second straight day on Monday, extending last week's recovery toward 0.7000 in Monday's Asian trading. Strong Chniese Q3 GDP and activity data for September strengthen the pair's advance, following RBA Assistant Governor Chris Kent's hawkish remarks.

USD/JPY struggles near 158.00 amid hawkish BoJ, subdued USD

USD/JPY remains defensive near 158.00 in the Asian session on Monday, as the US Dollar remains depressed near a two-week low amid the recent decline in US bond yields. Furthermore, looming intervention risks underpin the Japanese Yen and weigh on the pair amid BoJ Governor Kazuo Ueda's hawkish remarks. However, Fed rate-hike bets and geopolitical uncertainties could limit USD losses and the major.

Gold rangebound as easing October Fed bets clash with firm December hike pricing

Gold attracts some buyers at the start of a new week, though it lacks bullish conviction and remains below the $4,200 mark. US Federal Reserve Chair Kevin Warsh’s unwillingness to provide any cues on further policy moves led to a reduction in odds for policy tightening later this month. Moreover, the recent sharp retracement slide in US government bond yields from multi-year highs, which dragged the US Dollar to a two-week low, acts as a tailwind for the bullion.

Cardano risks 15% downside as retail demand, bullish momentum wane

Cardano (ADA) is trading above $0.2200 at press time on Monday, holding steady after a 12% decline the previous week. The altcoin is losing retail interest as the notional value of active ADA futures positions declines. The technical outlook for ADA suggests a downside bias following the bearish breakout below a near-term support trendline last week.

What to expect in the week ahead
Investors are still digesting last week’s price action as we start a new week. US stocks sold off sharply, with the Swiss and UK indices attracting inflows as tech sold off. Sovereign bonds, particularly Treasuries, rallied and acted as a safe haven as the AI trade suffered another bout of volatility.
Everyone's dumping Gold after hot US inflation. Here's why $4,100 could be a floor, not a cliff
Gold (XAU/USD) is recovering from a sharp sell-off triggered by hotter-than-expected United States (US) inflation data released on Wednesday. The precious metal briefly plunged toward $4,073 as investors increased their bets on further Federal Reserve (Fed) interest rate hikes before recovering as US Treasury yields and the US Dollar (USD) reversed their initial gains.