- GBP/USD prices remains lackluster after positing the biggest daily jump in a week.
- A clear upside break of 100-DMA joins bullish MACD signals, three-week-old support line to keep buyers hopeful.
- Horizontal area from August 20 precedes 61.8% Fibonacci retracement level to challenge bulls.
GBP/USD struggles to extend the previous day’s recovery moves near 1.3585 heading into Monday’s London open. In doing so, the cable pair seesaws below a horizontal resistance region established from August 20.
However, a clear upside break of the 100-DMA and a three-week-long uptrend, portrayed by the short-term support line, join the bullish MACD signals to favor buyers battling the 1.3600-3610 resistance zone.
It’s worth noting that the 61.8% Fibonacci retracement level of September-December downside, near 1.3625, adds to the upside filters before fueling the GBP/USD prices towards November’s peak near 1.3700.
Following that, the 200-DMA level surrounding 1.3740 will challenge the pair buyers afterward.
On the contrary, a convergence of the 100-DMA and aforementioned support line restricts short-term declines of the GBP/USD pair near 1.3555-3550.
Even if the cable pair drops below 1.3550, November 18 swing high and 38.2% Fibonacci retracement level, close to 1.3515 and 1.3450 in that order, will challenge the pair sellers.
GBP/USD: Daily chart
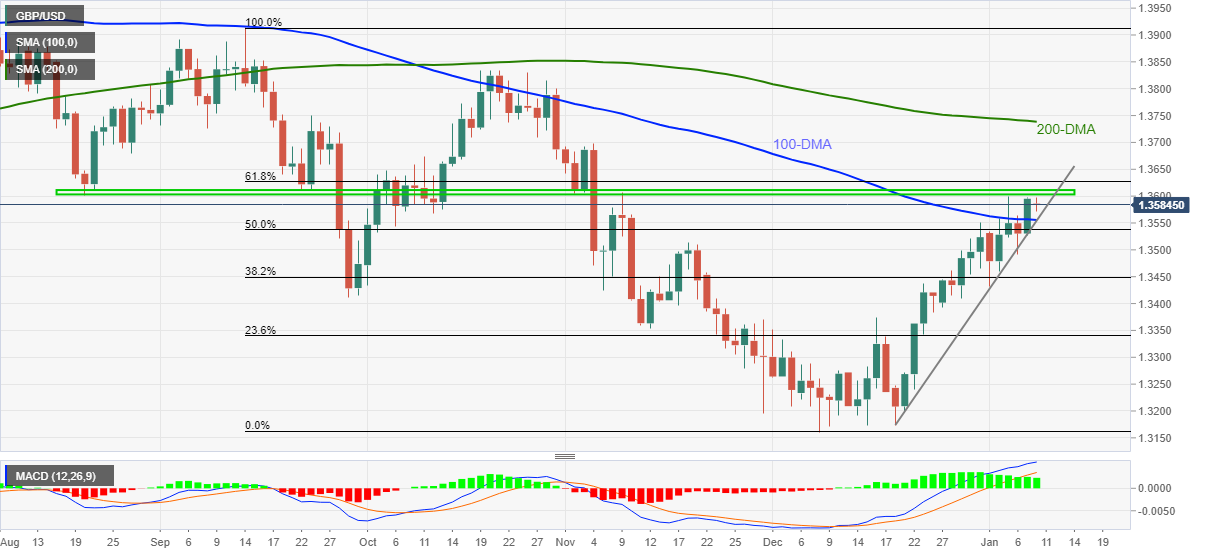
Trend: Further upside expected
Information on these pages contains forward-looking statements that involve risks and uncertainties. Markets and instruments profiled on this page are for informational purposes only and should not in any way come across as a recommendation to buy or sell in these assets. You should do your own thorough research before making any investment decisions. FXStreet does not in any way guarantee that this information is free from mistakes, errors, or material misstatements. It also does not guarantee that this information is of a timely nature. Investing in Open Markets involves a great deal of risk, including the loss of all or a portion of your investment, as well as emotional distress. All risks, losses and costs associated with investing, including total loss of principal, are your responsibility. The views and opinions expressed in this article are those of the authors and do not necessarily reflect the official policy or position of FXStreet nor its advertisers. The author will not be held responsible for information that is found at the end of links posted on this page.
If not otherwise explicitly mentioned in the body of the article, at the time of writing, the author has no position in any stock mentioned in this article and no business relationship with any company mentioned. The author has not received compensation for writing this article, other than from FXStreet.
FXStreet and the author do not provide personalized recommendations. The author makes no representations as to the accuracy, completeness, or suitability of this information. FXStreet and the author will not be liable for any errors, omissions or any losses, injuries or damages arising from this information and its display or use. Errors and omissions excepted.
The author and FXStreet are not registered investment advisors and nothing in this article is intended to be investment advice.
Recommended content
Editors’ Picks
EUR/USD holds above 1.0700 ahead of key US data
EUR/USD trades in a tight range above 1.0700 in the early European session on Friday. The US Dollar struggles to gather strength ahead of key PCE Price Index data, the Fed's preferred gauge of inflation, and helps the pair hold its ground.
USD/JPY jumps above 156.00 on BoJ's steady policy
USD/JPY has come under intense buying pressure, surging past 156.00 after the Bank of Japan kept the key rate unchanged but tweaked its policy statement. The BoJ maintained its fiscal year 2024 and 2025 core inflation forecasts, disappointing the Japanese Yen buyers.
Gold price flatlines as traders look to US PCE Price Index for some meaningful impetus
Gold price lacks any firm intraday direction and is influenced by a combination of diverging forces. The weaker US GDP print and a rise in US inflation benefit the metal amid subdued USD demand. Hawkish Fed expectations cap the upside as traders await the release of the US PCE Price Index.
Sei Price Prediction: SEI is in the zone of interest after a 10% leap
Sei price has been in recovery mode for almost ten days now, following a fall of almost 65% beginning in mid-March. While the SEI bulls continue to show strength, the uptrend could prove premature as massive bearish sentiment hovers above the altcoin’s price.
US core PCE inflation set to signal firm price pressures as markets delay Federal Reserve rate cut bets
The core PCE Price Index, which excludes volatile food and energy prices, is seen as the more influential measure of inflation in terms of Fed positioning. The index is forecast to rise 0.3% on a monthly basis in March, matching February’s increase.