|

GBP/USD Price Analysis: Cable bulls prod 50-DMA hurdle above 1.2100 as the key week begins

  • GBP/USD rises to the highest levels in two weeks during a four-day uptrend.
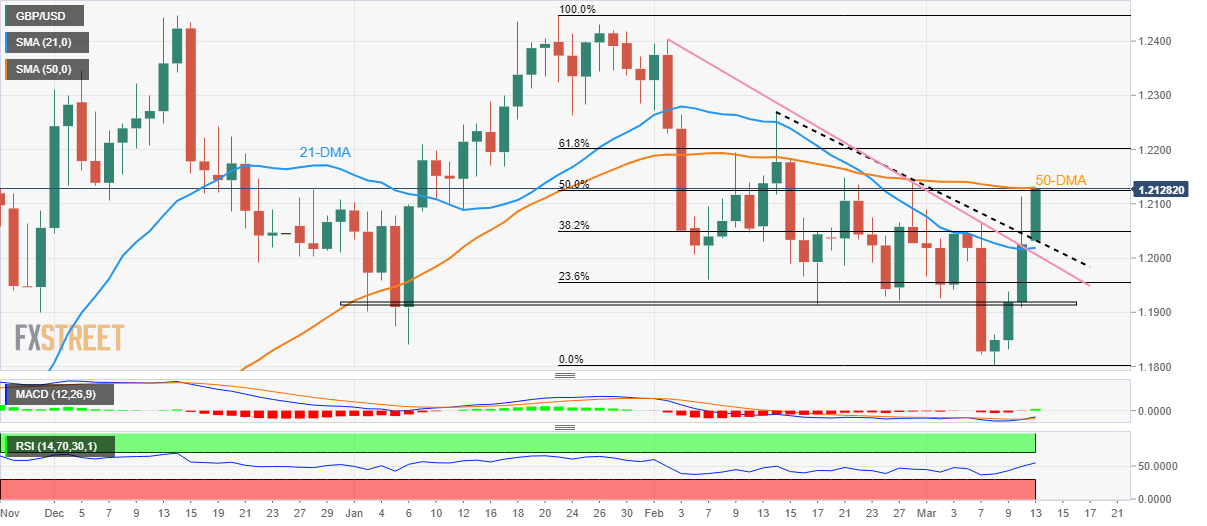
  • Clear upside break of 21-DMA, previous resistance lines join bullish MACD signal to favor buyers.
  • Sellers need validation from 1.1920-10 support zone for conviction.

GBP/USD takes the bids to refresh a three-week high near 1.2125-30 during early Monday morning in Europe. It should be noted that the multiple catalysts including the UK jobs report and the US inflation data highlight this week an important one for the Cable traders.

Also read: GBP/USD bulls are in the market testing bear commitments at 1.2100

That said, the quote cheers the upside break of the 21-DMA and previous resistance lines from early February. Adding strength to the north-side bias are the recently bullish MACD signals and the above 50 levels of RSI (14) that back the last week’s recovery moves.

It’s worth noting, however, that a convergence of the 50-DMA and 50% Fibonacci retracement level around 1.2130 appears the key hurdle for the GBP/USD buyers to cross to keep the reins.

Following that, the Cable pair’s run-up towards the 61.8% Fibonacci retracement level of late January to early March downturn and the mid-February swing high, respectively near 1.2205 and 1.2270 in that order, can’t be ruled out.

Meanwhile, the pullback move may initially aim for the one-month-old resistance-turned-support line, near 1.2030 at the latest, before poking the 21-DMA level of around 1.2020.

In a case where the GBP/USD bears keep control past 1.2020, the previous resistance line from February 02, near the 1.2000 psychological magnet at the latest, appears important to watch.

Even so, the GBP/USD pair sellers should remain cautious unless it breaks the nine-week-old horizontal support line near 1.1920-10.

GBP/USD: Daily chart

Trend: Further upside expected

Additional impotant levels

Overview
Today last price1.2123
Today Daily Change0.0098
Today Daily Change %0.81%
Today daily open1.2025
 
Trends
Daily SMA201.2014
Daily SMA501.2129
Daily SMA1001.2017
Daily SMA2001.1901
 
Levels
Previous Daily High1.2114
Previous Daily Low1.1908
Previous Weekly High1.2114
Previous Weekly Low1.1803
Previous Monthly High1.2402
Previous Monthly Low1.1915
Daily Fibonacci 38.2%1.2035
Daily Fibonacci 61.8%1.1987
Daily Pivot Point S11.1918
Daily Pivot Point S21.181
Daily Pivot Point S31.1712
Daily Pivot Point R11.2124
Daily Pivot Point R21.2222
Daily Pivot Point R31.233

Author

Anil Panchal

Anil Panchal

FXStreet

Anil Panchal has nearly 15 years of experience in tracking financial markets. With a keen interest in macroeconomics, Anil aptly tracks global news/updates and stays well-informed about the global financial moves and their implications.

More from Anil Panchal
Share:

Editor's Picks

EUR/USD slumps below 1.1750 as USD benefits from risk-aversion

EUR/USD comes under renewed bearish pressure in the European session and trades below 1.1750 following a recovery attempt earlier in the day. The US Dollar gathers strength and weighs on the pair as investors seek refuge in the wake of Israel and the United States' joint attack on Iran.

GBP/USD targets 1.3500 barrier near moving averages

GBP/USD rebounds from the daily losses, trading around 1.3450 during the Asian hours on Monday. The technical analysis of the daily chart indicates an ongoing bearish bias, as the pair trades within a descending channel pattern.

Gold surges on safe-haven demand, rises above $5,400

Gold benefits from intense risk-aversion on Monday and climbs above $5,400, setting a fresh monthly-high in the process. Tensions in the Middle East remain high as Israel and Hezbollah continue to exchange strikes following the US-Israel joint attack on Iran over the weekend.

Bitcoin, Ethereum and Ripple under pressure as key supports face breakdown risk

Bitcoin, Ethereum, and Ripple prices trade on the back foot at the start of this week on Monday, after extending losses in the previous week. BTC is on the brink of a breakdown, ETH is capped below key resistance, and XRP risks a crack of the trendline.

The market is paying for insurance, not apocalypse

As expected, this morning felt less like a Monday market open and more like a fire drill. Futures screens flickered red. S&P contracts down almost 1%. Nasdaq off 1.2%. Brent leaped 13% through $80. Gold rose 1.6% toward $5350 before paring some gains. The dollar is strutting mildly. The Swiss franc is quietly doing what it always does in a storm, catching some safe-haven flows.

Pi Network Price Forecast: Core team offloads supply, weighing on PI recovery

Pi Network  hovers below $0.1700, broadly steady at press time on Monday, attempting a recovery after a 2% loss the previous day. Sunday’s decline aligned with nearly 49 million PI tokens offloaded by the Pi Foundation, implying a spike in supply pressure that capped the prevailing four-day recovery.