- GBP/USD stalled the previous day’s retracement slide near ascending channel support.
- A sustained breakthrough is needed to support prospects for a further near-term decline.
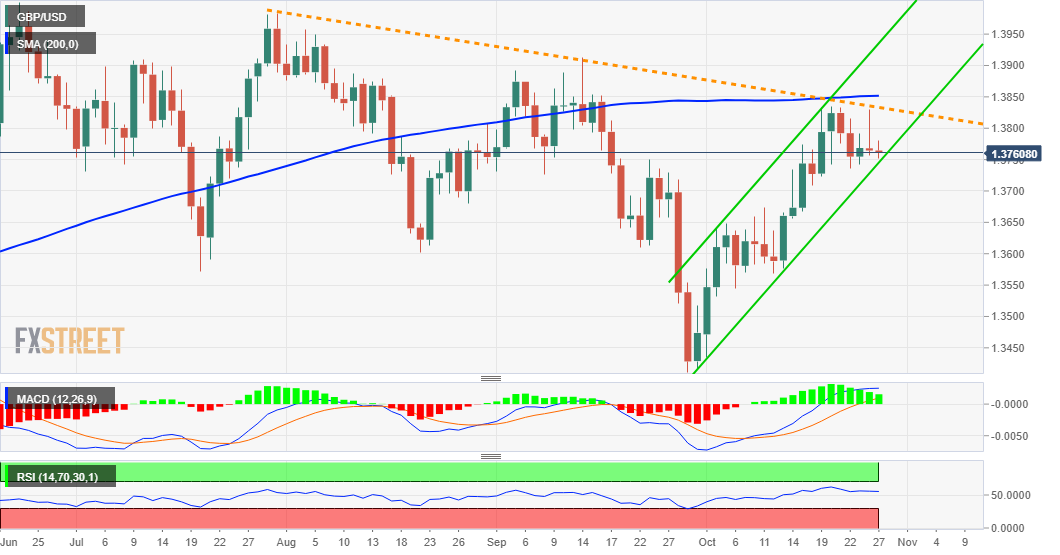
The GBP/USD pair witnessed an intraday turnaround from a short-term descending trend-line extending from late July and retreated over 70 pips from the 1.3825-30 resistance zone on Tuesday. The pullback, however, lacked strong follow-through selling and the pair, so far, has managed to defend support marked by the lower boundary of an upward sloping channel.
The dominant risk-on mood failed to assist the safe-haven US dollar to capitalize on the previous day's upbeat US data-inspired gains, instead led to a subdued/range-bound price action on Wednesday. This, in turn, extended some support to the GBP/USD pair amid rising bets for an imminent Bank of England rate hike move later this year.
That said, tensions between the UK and France over fishing rights, along with a fresh row over the Northern Ireland protocol acted as a headwind for the British pound. Investors also seemed reluctant to place any aggressive bets around the GBP/USD pair ahead of the annual budget announcement by the UK Finance Minister Rishi Sunak.
Meanwhile, technical indicators on the daily chart – though have been losing positive traction – are still holding in the bullish territory. This further makes it prudent to wait for a sustained break below the trend-channel support before confirming that the recent positive move has run out of steam and placing fresh bearish bets.
The GBP/USD pair might then accelerate the corrective slide to the 1.3725 intermediate support en-route the 1.3700 mark and the next relevant support near mid-1.3600s. Some follow-through selling will set the stage for fall towards testing sub-1.3600 levels ahead of the BoE and FOMC monetary policy meetings next week.
On the flip side, the 1.3790-1.3800 region now seems to act as immediate resistance for the GBP/USD pair ahead of the descending trend-line, around the 1.3825-30 supply zone. This is closely followed by the very important 200-day SMA, around mid-1.3800s, which if cleared will be seen as a fresh trigger for bullish traders.
GBP/USD daily chart
Technical levels to watch
Information on these pages contains forward-looking statements that involve risks and uncertainties. Markets and instruments profiled on this page are for informational purposes only and should not in any way come across as a recommendation to buy or sell in these assets. You should do your own thorough research before making any investment decisions. FXStreet does not in any way guarantee that this information is free from mistakes, errors, or material misstatements. It also does not guarantee that this information is of a timely nature. Investing in Open Markets involves a great deal of risk, including the loss of all or a portion of your investment, as well as emotional distress. All risks, losses and costs associated with investing, including total loss of principal, are your responsibility. The views and opinions expressed in this article are those of the authors and do not necessarily reflect the official policy or position of FXStreet nor its advertisers. The author will not be held responsible for information that is found at the end of links posted on this page.
If not otherwise explicitly mentioned in the body of the article, at the time of writing, the author has no position in any stock mentioned in this article and no business relationship with any company mentioned. The author has not received compensation for writing this article, other than from FXStreet.
FXStreet and the author do not provide personalized recommendations. The author makes no representations as to the accuracy, completeness, or suitability of this information. FXStreet and the author will not be liable for any errors, omissions or any losses, injuries or damages arising from this information and its display or use. Errors and omissions excepted.
The author and FXStreet are not registered investment advisors and nothing in this article is intended to be investment advice.
Recommended content
Editors’ Picks
EUR/USD clings to gains above 1.0750 after US data
EUR/USD manages to hold in positive territory above 1.0750 despite retreating from the fresh multi-week high it set above 1.0800 earlier in the day. The US Dollar struggles to find demand following the weaker-than-expected NFP data.
GBP/USD declines below 1.2550 following NFP-inspired upsurge
GBP/USD struggles to preserve its bullish momentum and trades below 1.2550 in the American session. Earlier in the day, the disappointing April jobs report from the US triggered a USD selloff and allowed the pair to reach multi-week highs above 1.2600.
Gold struggles to hold above $2,300 despite falling US yields
Gold stays on the back foot below $2,300 in the American session on Friday. The benchmark 10-year US Treasury bond yield stays in negative territory below 4.6% after weak US data but the improving risk mood doesn't allow XAU/USD to gain traction.
Bitcoin Weekly Forecast: Should you buy BTC here? Premium
Bitcoin (BTC) price shows signs of a potential reversal but lacks confirmation, which has divided the investor community into two – those who are buying the dips and those who are expecting a further correction.
Week ahead – BoE and RBA decisions headline a calm week
Bank of England meets on Thursday, unlikely to signal rate cuts. Reserve Bank of Australia could maintain a higher-for-longer stance. Elsewhere, Bank of Japan releases summary of opinions.