GBP/USD Price Analysis: Bulls have the upper hand, ascending channel breakout in play
- GBP/USD struggles to gain any meaningful traction on Monday and consolidates in a range.
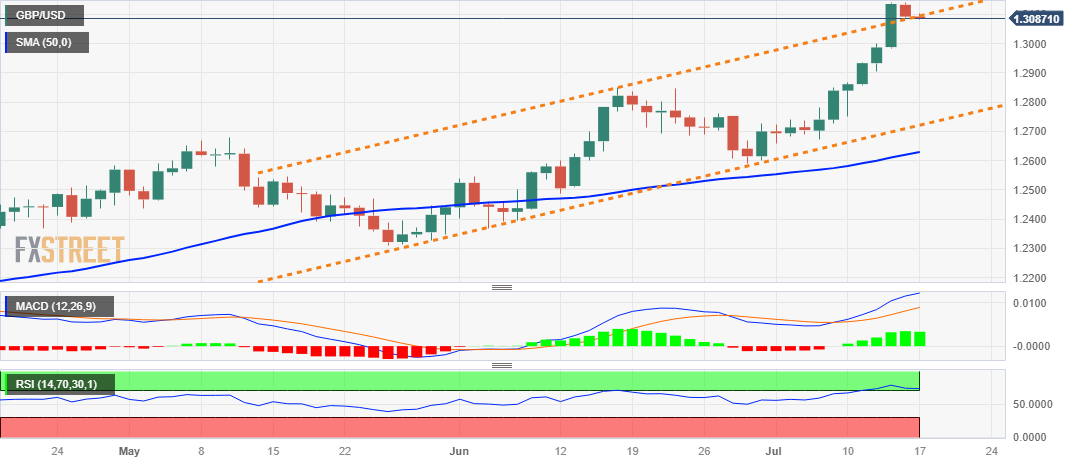
- Last week's breakout through a one-month-old ascending trend channel favours bullish traders.
- Any meaningful corrective decline might be seen as a buying opportunity and remain limited.

The GBP/USD pair lacks any firm directional bias and oscillates in a narrow trading band, just below the 1.3100 round-figure mark through the first half of the Asian session on Monday. Spot prices, however, remain well within the striking distance of the highest level since April 2022, around the 1.3140 region touched on Friday, and seem poised to prolong the recent upward trajectory witnessed over the past two weeks or so.
The US Dollar (USD) struggles to capitalize on Friday's modest bounce from a 15-month low in the wake of firming expectations that the Federal Reserve (Fed) will end its rate-hiking cycle after the anticipated 25 bps lift-off in July. The British Pound (GBP), on the other hand, remains well supported by rising bets for a more aggressive policy tightening by the Bank of England (BoE) to curb high inflation. This suggests that the path of least resistance for the GBP/USD pair is to the upside and any meaningful corrective slide might still be seen as a buying opportunity.
From a technical perspective, last week's sustained breakout through a resistance marked by the top end of a nearly one-month-old ascending channel validates the positive outlook. That said, oscillators on the daily chart are flashing slightly overbought conditions and holding back traders from placing fresh bullish bets around the GBP/USD pair. In the absence of any relevant macro data from the UK, this makes it prudent to wait for some near-term consolidation or a modest pullback before positioning for a further near-term appreciating move for the major.
In the meantime, the 1.3040-1.3035 region might now act as immediate support ahead of the 1.3000 psychological mark, which if broken decisively might prompt some technical selling. The GBP/USD pair might then slide towards the next relevant support near the 1.2930 horizontal zone, though any subsequent slide could attract fresh buyers near the 1.2900 round figure. This should help limit the downside for spot prices near the 1.2850 horizontal resistance breakpoint.
On the flip side, bulls might now wait for some follow-through buying above the 1.3140 region, or the multi-month peak, before placing fresh bets. The GBP/USD pair could then accelerate the momentum towards the 1.3200 mark. The uptrend could get extended towards the 1.3250-1.3260 intermediate hurdle, above which spot prices seem poised to climb further to reclaim the 1.3300 mark for the first time since March 2022.
GBP/USD daily chart
Key levels to watch
Author

Haresh Menghani
FXStreet
Haresh Menghani is a detail-oriented professional with 10+ years of extensive experience in analysing the global financial markets.


