GBP/USD Price Analysis: Bulls eye a break of key daily structure
- GBP/USD is starting to correct the recent bullish impulse.
- Bulls have eyes set on a full-on breakout, away from the counter trendline.

GBP/USD is a touch higher in early Asia following a bullish impulse at the start of this week. The pair has been in the hands of the bulls for the most part of Monday but there is still room to go to the upside before bullish territory. The following illustrates the longer-term prospects for a move higher while noting the hourly chart structure and the possibility of a meanwhile correction.
GBP/USD daily chart
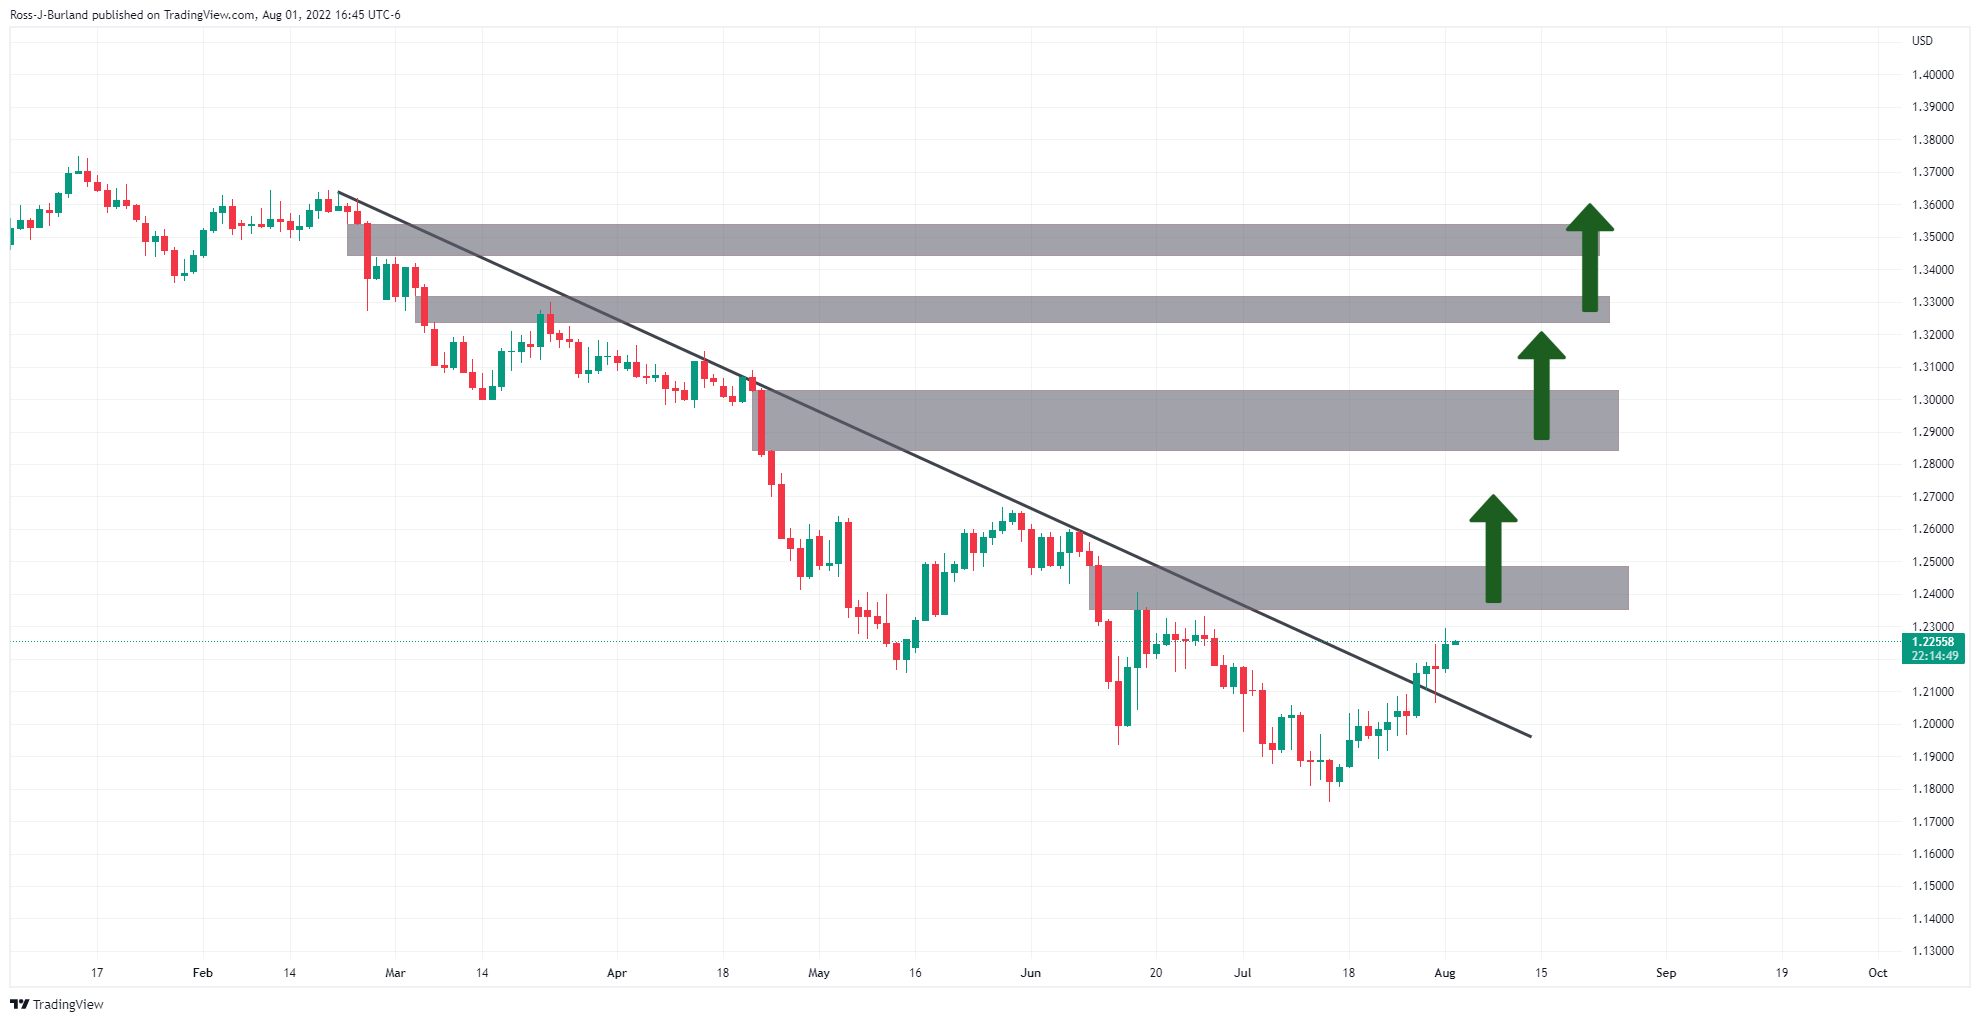
The greyed areas on the daily chart above are areas of price imbalance. The bulls have broken a trendline resistance but are still below the key structure near 1.2380. Until this is broken, a phase of price discovery could play out in a sideways range for the days ahead.
GBP/USD H4 chart
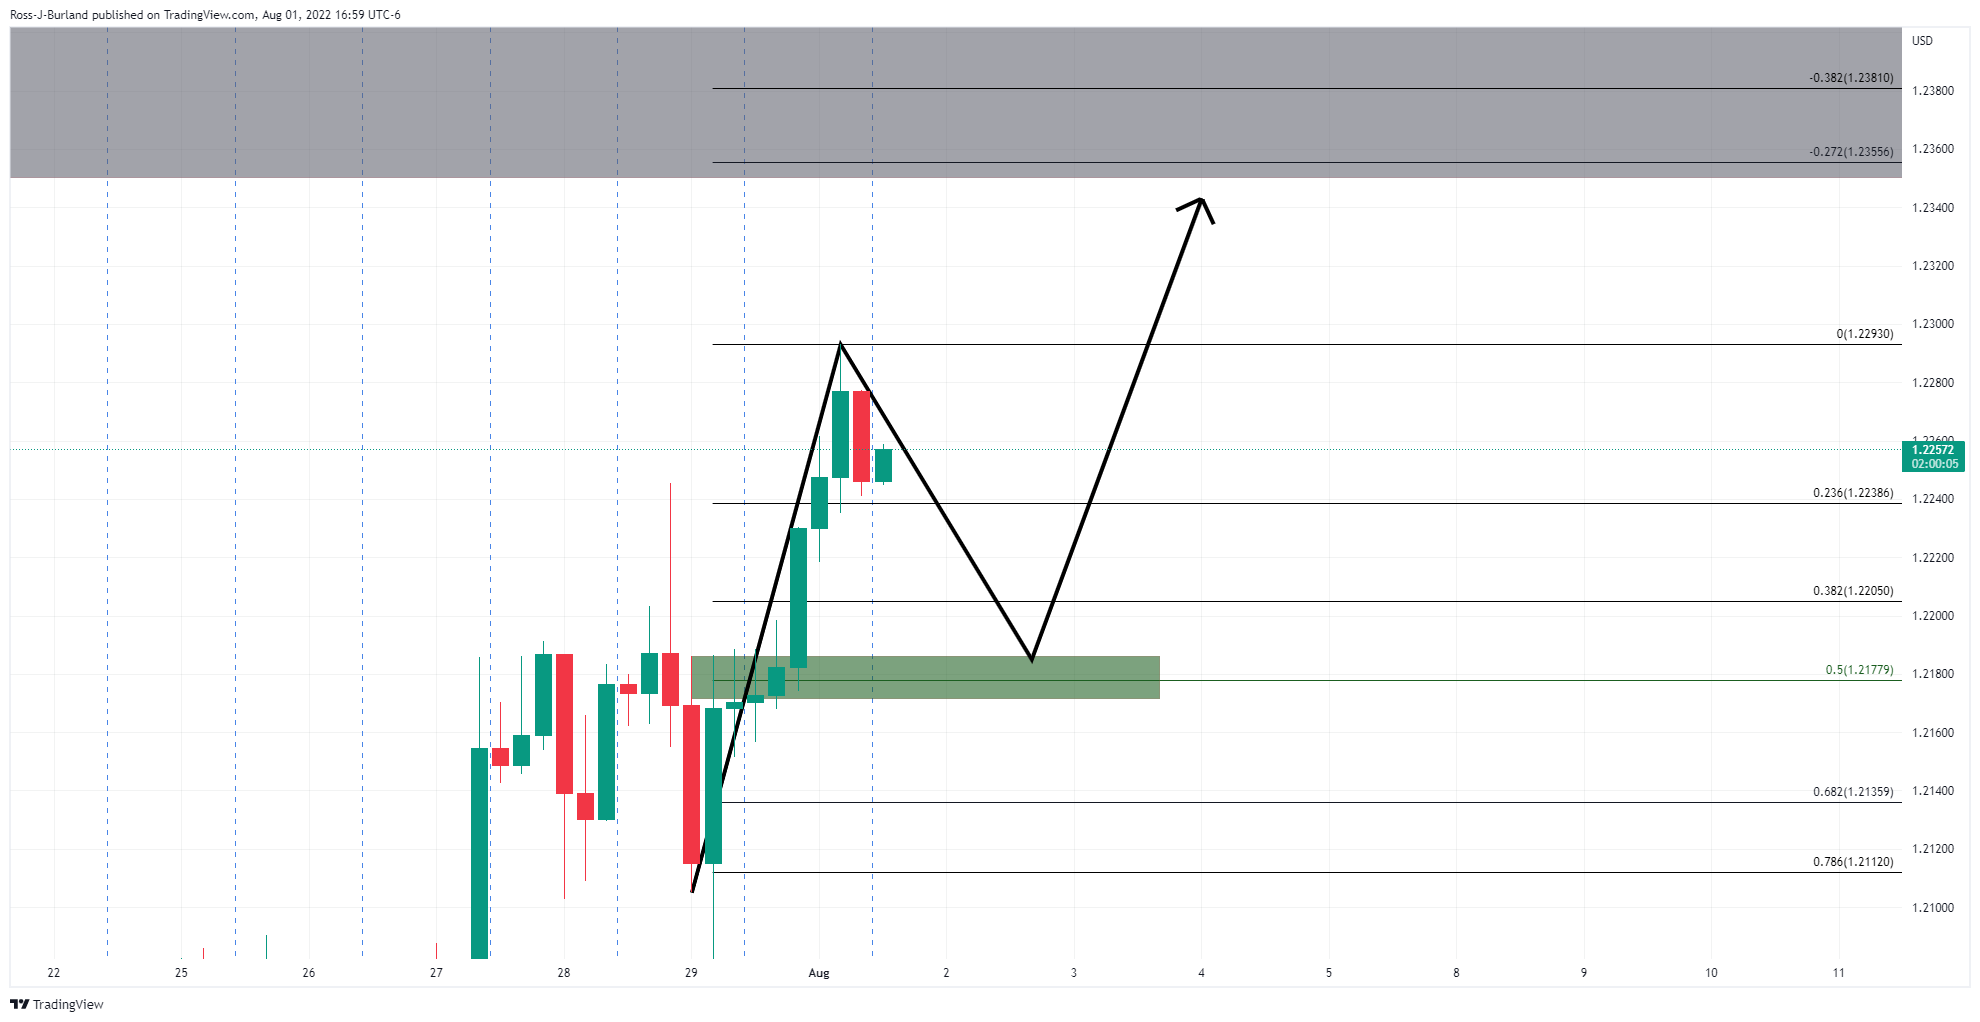
This opens the risk of a correction in the near term and the 50% mean reversion level on the hourly chart aligns with the prior structure near 1.2180.
Author

Ross J Burland
FXStreet
Ross J Burland, born in England, UK, is a sportsman at heart. He played Rugby and Judo for his county, Kent and the South East of England Rugby team.


