|
GBP/USD Price Analysis: Bears stacked up to test trendline support
- GBP/USD bears are moving in and eye a downside break of trendline support.
- The 4-hour 38.2% Fibonacci could be significant in the session ahead.

The safe-haven US dollar rose on Tuesday as market sentiment turned risk-averse amid further worries about the banking sector. This has flipped the technicals in GBP/USD bearish once again.
GBP/USD daily chart
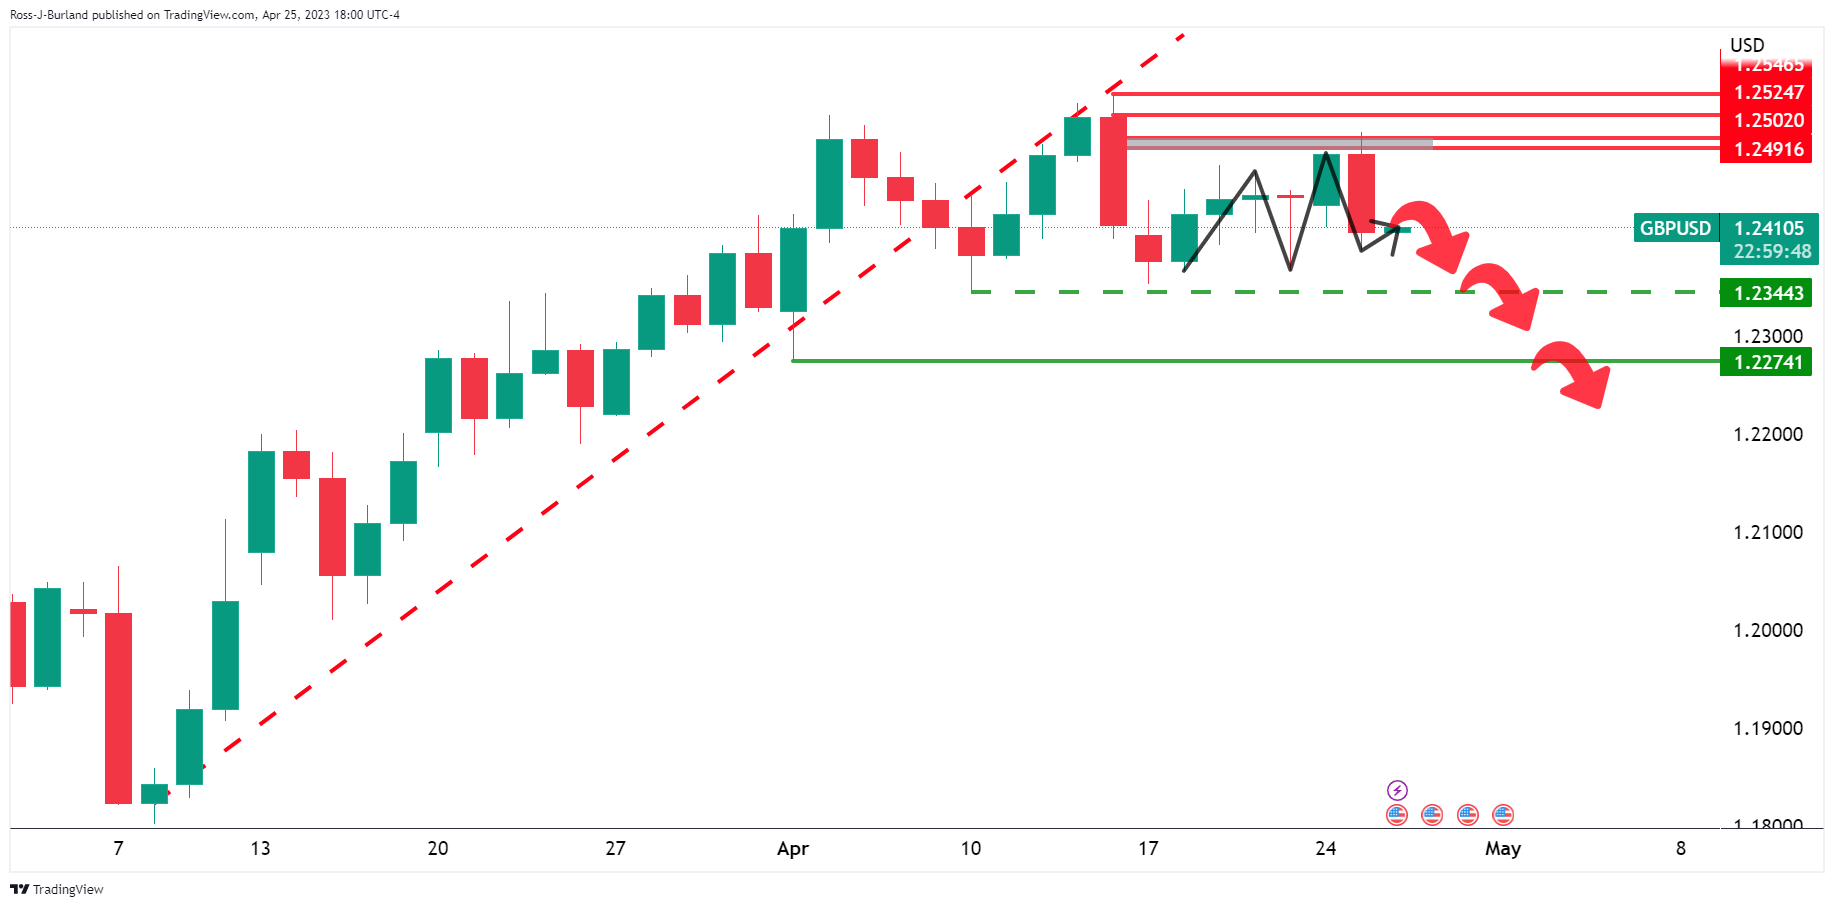
The Daily M-formation is in play. The bears will need to commit to any pullbacks, however, on the lower time frames as follows:
GBP/USD H4 chart
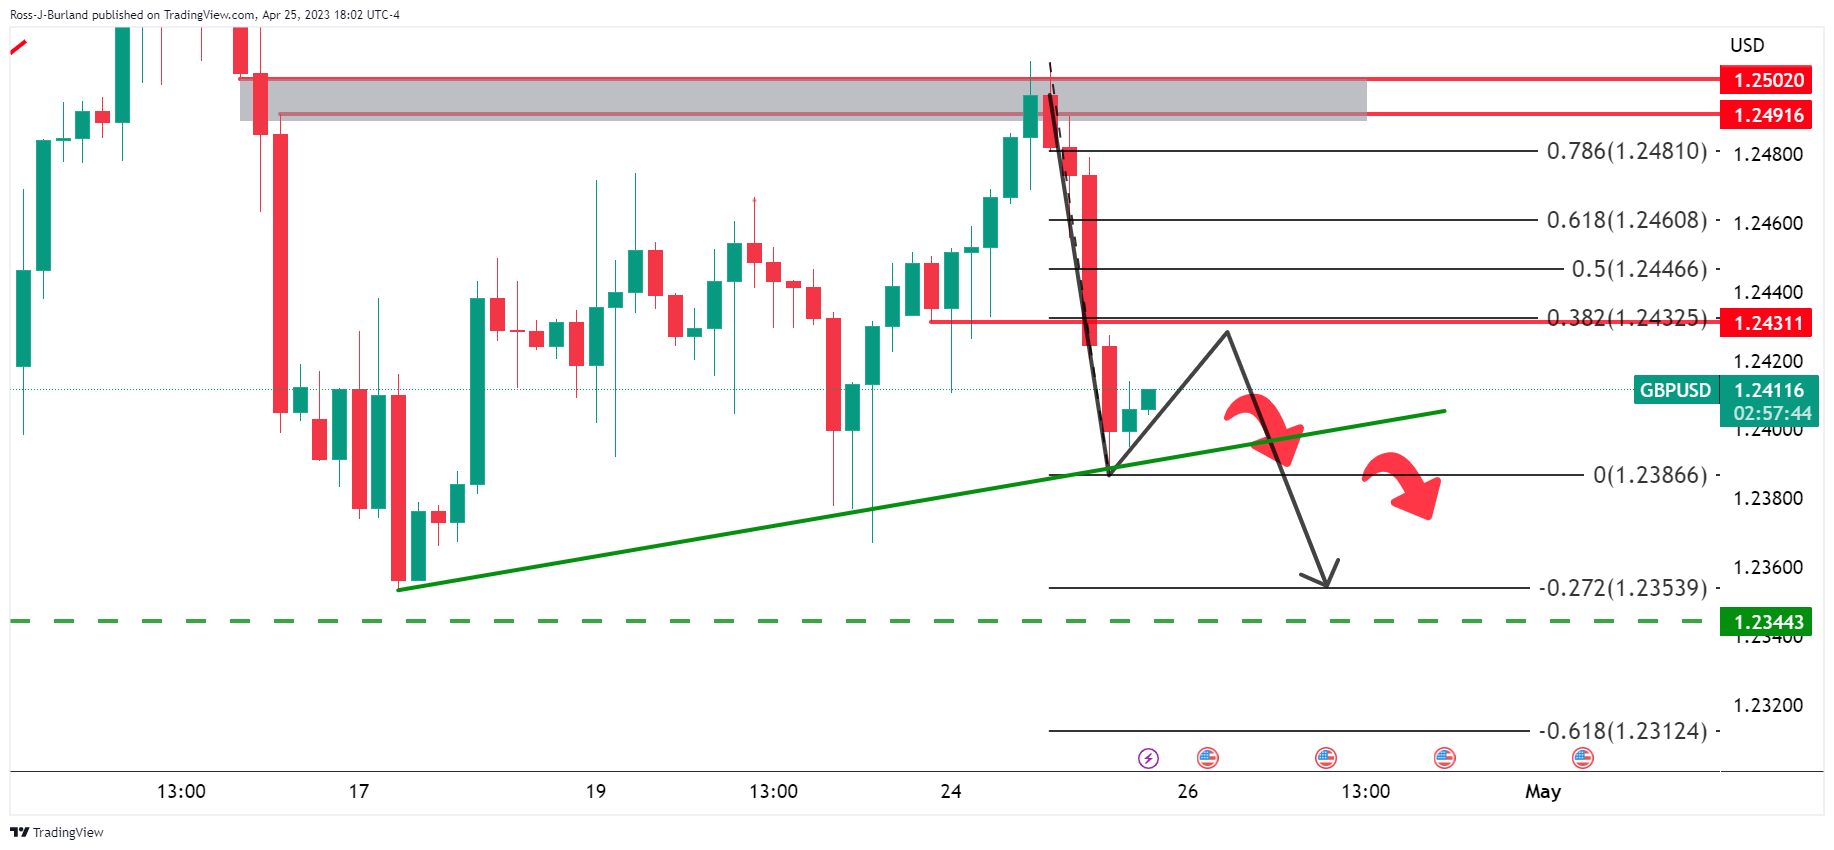
The pair is testing trendline support but should the bears show up at the 38.2% Fibonacci in any decent size, meeting the 4-hour charts M-formaiton´s neckline, then the bias will start to move bearish again.
Author

Ross J Burland
FXStreet
Ross J Burland, born in England, UK, is a sportsman at heart. He played Rugby and Judo for his county, Kent and the South East of England Rugby team.
More from Ross J Burland


