Breaking: US GDP expands 1.4% in Q4 vs. 3% expected

The United States' (US) Gross Domestic Product (GDP) expanded at an annual rate of 1.4% in the fourth quarter of 2025, the US Bureau of Economic Analysis (BEA) reported in its initial estimate on Friday. This print followed the 4.4% growth recorded in the previous quarter and missed the market expectation of 3% by a wide margin.
"The contributors to the increase in real GDP in the fourth quarter were increases in consumer spending and investment. These movements were partly offset by decreases in government spending and exports. Imports, which are a subtraction in the calculation of GDP, decreased," the BEA explained in its press release.
Other details of the report showed that the core Personal Consumption Expenditures (PCE) Price Index rose by 2.7% on a quarterly basis in the fourth quarter, below the 2.9% increase recorded in the previous quarter but above the market expectation of 2.6%. On a monthly basis, the core PCE Price Index increased by 0.4% in December, up from 0.2% in November.
Market reaction to US GDP data
The market reaction to the US data was largely muted. At the time of press, the US Dollar Index was up 0.13% on the day at 97.93.
US Dollar Price This week
The table below shows the percentage change of US Dollar (USD) against listed major currencies this week. US Dollar was the strongest against the Japanese Yen.
| USD | EUR | GBP | JPY | CAD | AUD | NZD | CHF | |
|---|---|---|---|---|---|---|---|---|
| USD | 0.92% | 1.26% | 1.74% | 0.60% | 0.37% | 1.33% | 1.04% | |
| EUR | -0.92% | 0.34% | 0.80% | -0.31% | -0.55% | 0.40% | 0.13% | |
| GBP | -1.26% | -0.34% | 0.21% | -0.66% | -0.88% | 0.06% | -0.21% | |
| JPY | -1.74% | -0.80% | -0.21% | -1.12% | -1.32% | -0.40% | -0.64% | |
| CAD | -0.60% | 0.31% | 0.66% | 1.12% | -0.27% | 0.72% | 0.45% | |
| AUD | -0.37% | 0.55% | 0.88% | 1.32% | 0.27% | 0.96% | 0.69% | |
| NZD | -1.33% | -0.40% | -0.06% | 0.40% | -0.72% | -0.96% | -0.27% | |
| CHF | -1.04% | -0.13% | 0.21% | 0.64% | -0.45% | -0.69% | 0.27% |
The heat map shows percentage changes of major currencies against each other. The base currency is picked from the left column, while the quote currency is picked from the top row. For example, if you pick the US Dollar from the left column and move along the horizontal line to the Japanese Yen, the percentage change displayed in the box will represent USD (base)/JPY (quote).
This section below was published as a preview of the United States' (US) Gross Domestic Product (GDP) data at 05:00 GMT.
- The US Gross Domestic Product growth is expected to have eased to 3% in Q4 from 4.4% in Q3, partly due to the lag from the extended government shutdown.
- Weak consumption and a sluggish labour market are boosting concerns about the US economy.
- Traders will also be attentive to the PCE Price Index, due at the same time on Friday.
The United States (US) Bureau of Economic Analysis (BEA) will publish the first preliminary estimate of the fourth-quarter Gross Domestic Product (GDP) at 13:30 GMT.

Analysts forecast the US economy to have expanded at a 3% annualized rate, slowing down from the 4.4% growth posted in the previous quarter, as the extended US government shutdown, extending from October to mid-November, hit economic growth.
Investors see US economic strength faltering in Q4
The US economy is expected to have switched a gear down in the last three months of 2025, following a surprising acceleration in the previous quarter. The 3% annualized GDP forecast is still revealing a healthy growth rate compared with other major economies, but it underscores some of the weaknesses seen in recent weeks and might dent the theory of US economic exceptionalism.
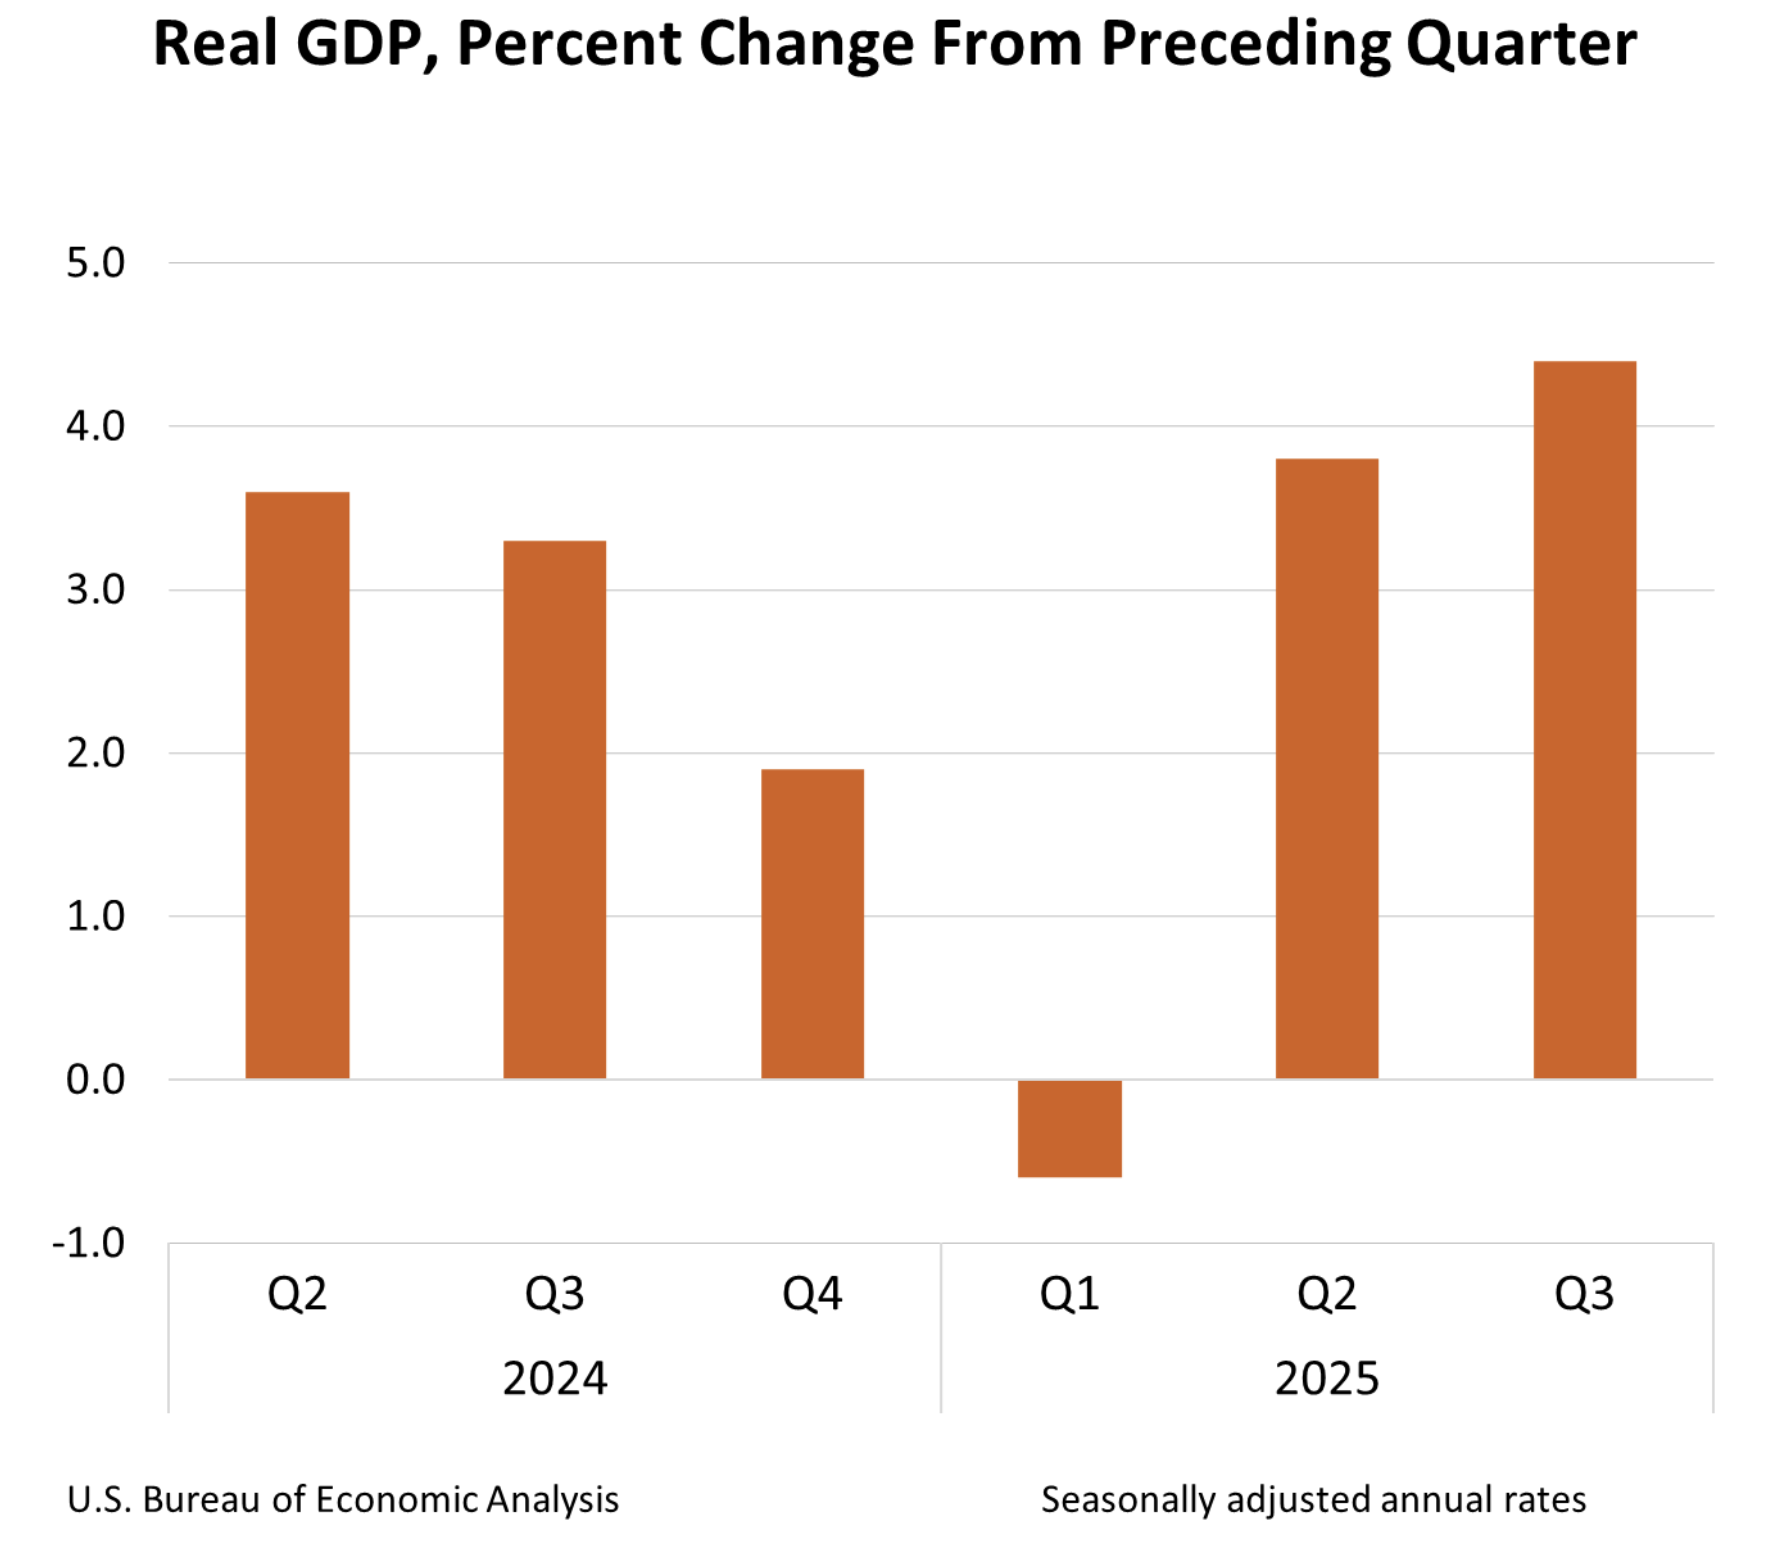
The US government shutdown is likely to have contributed to the economic slowdown. “We estimate real GDP grew at a 1.6% annualized pace in Q4, with most of the weakness attributable to the extended government shutdown from early October through mid‑November, which likely shaved roughly 1.2 percentage points from headline growth,” economists from Wells Fargo said in a research note. Stripping out the shutdown effects, the underlying fundamentals remain solid, they added.
Still, the labour market remains the main concern. January’s Nonfarm Payrolls revealed an unexpectedly strong increase in net jobs and a decline in unemployment, but nearly two-thirds of the new vacancies were concentrated in the health sector. Beyond that, employment data from 2025 was revised down to 181,000 from previous estimations of 584,000, far fewer than the 1.46 million jobs created in 2024.
Moreover, consumption, which accounts for nearly 70% of the GDP, is showing a worrying trend. Retail Sales stalled in December amid a decline in big-ticket sales, and data from October was downwardly revised. It seems that the uncertain employment expectations and a rising cost of living, due in part to trade tariffs, are starting to pinch on consumers’ sentiment, weighing on the economic growth.
Alongside the Q4 GDP, the US Bureau of Economic Analysis (BEA) will also release the preliminary US Personal Consumption Expenditures (PCE) Price Index data for December. The US Federal Reserve’s (Fed) preferred inflation gauge is expected to show that inflation remains sticky, closer to a 3% year-on-year growth than to the Fed’s 2% target rate. The risk is on a mix of low growth and hot inflation that would pose a headache for the Fed and might trigger wild US Dollar fluctuations.
When will the Gross Domestic Product print be released, and how can it affect the US Dollar Index?
The US GDP report is due at 13:30 GMT, alongside the US PCE Price Index report. Trading volumes have been subdued at the start of the week as investors await key economic releases at later dates. Bearing this in mind, it is likely that, if both readings point to the same monetary policy direction, they might have a significant impact on the US Dollar’s (USD) volatility.
Friday’s data is likely to be a test of the frail US Dollar recovery witnessed this week. The Euro (EUR) and the Japanese Yen (JPY) are losing momentum, and the Pound Sterling (GBP) struggles as soft UK economic growth and inflation figures have boosted hopes of BoE monetary easing in March. The Greenback, however, will need support from domestic data to confirm a trend shift.
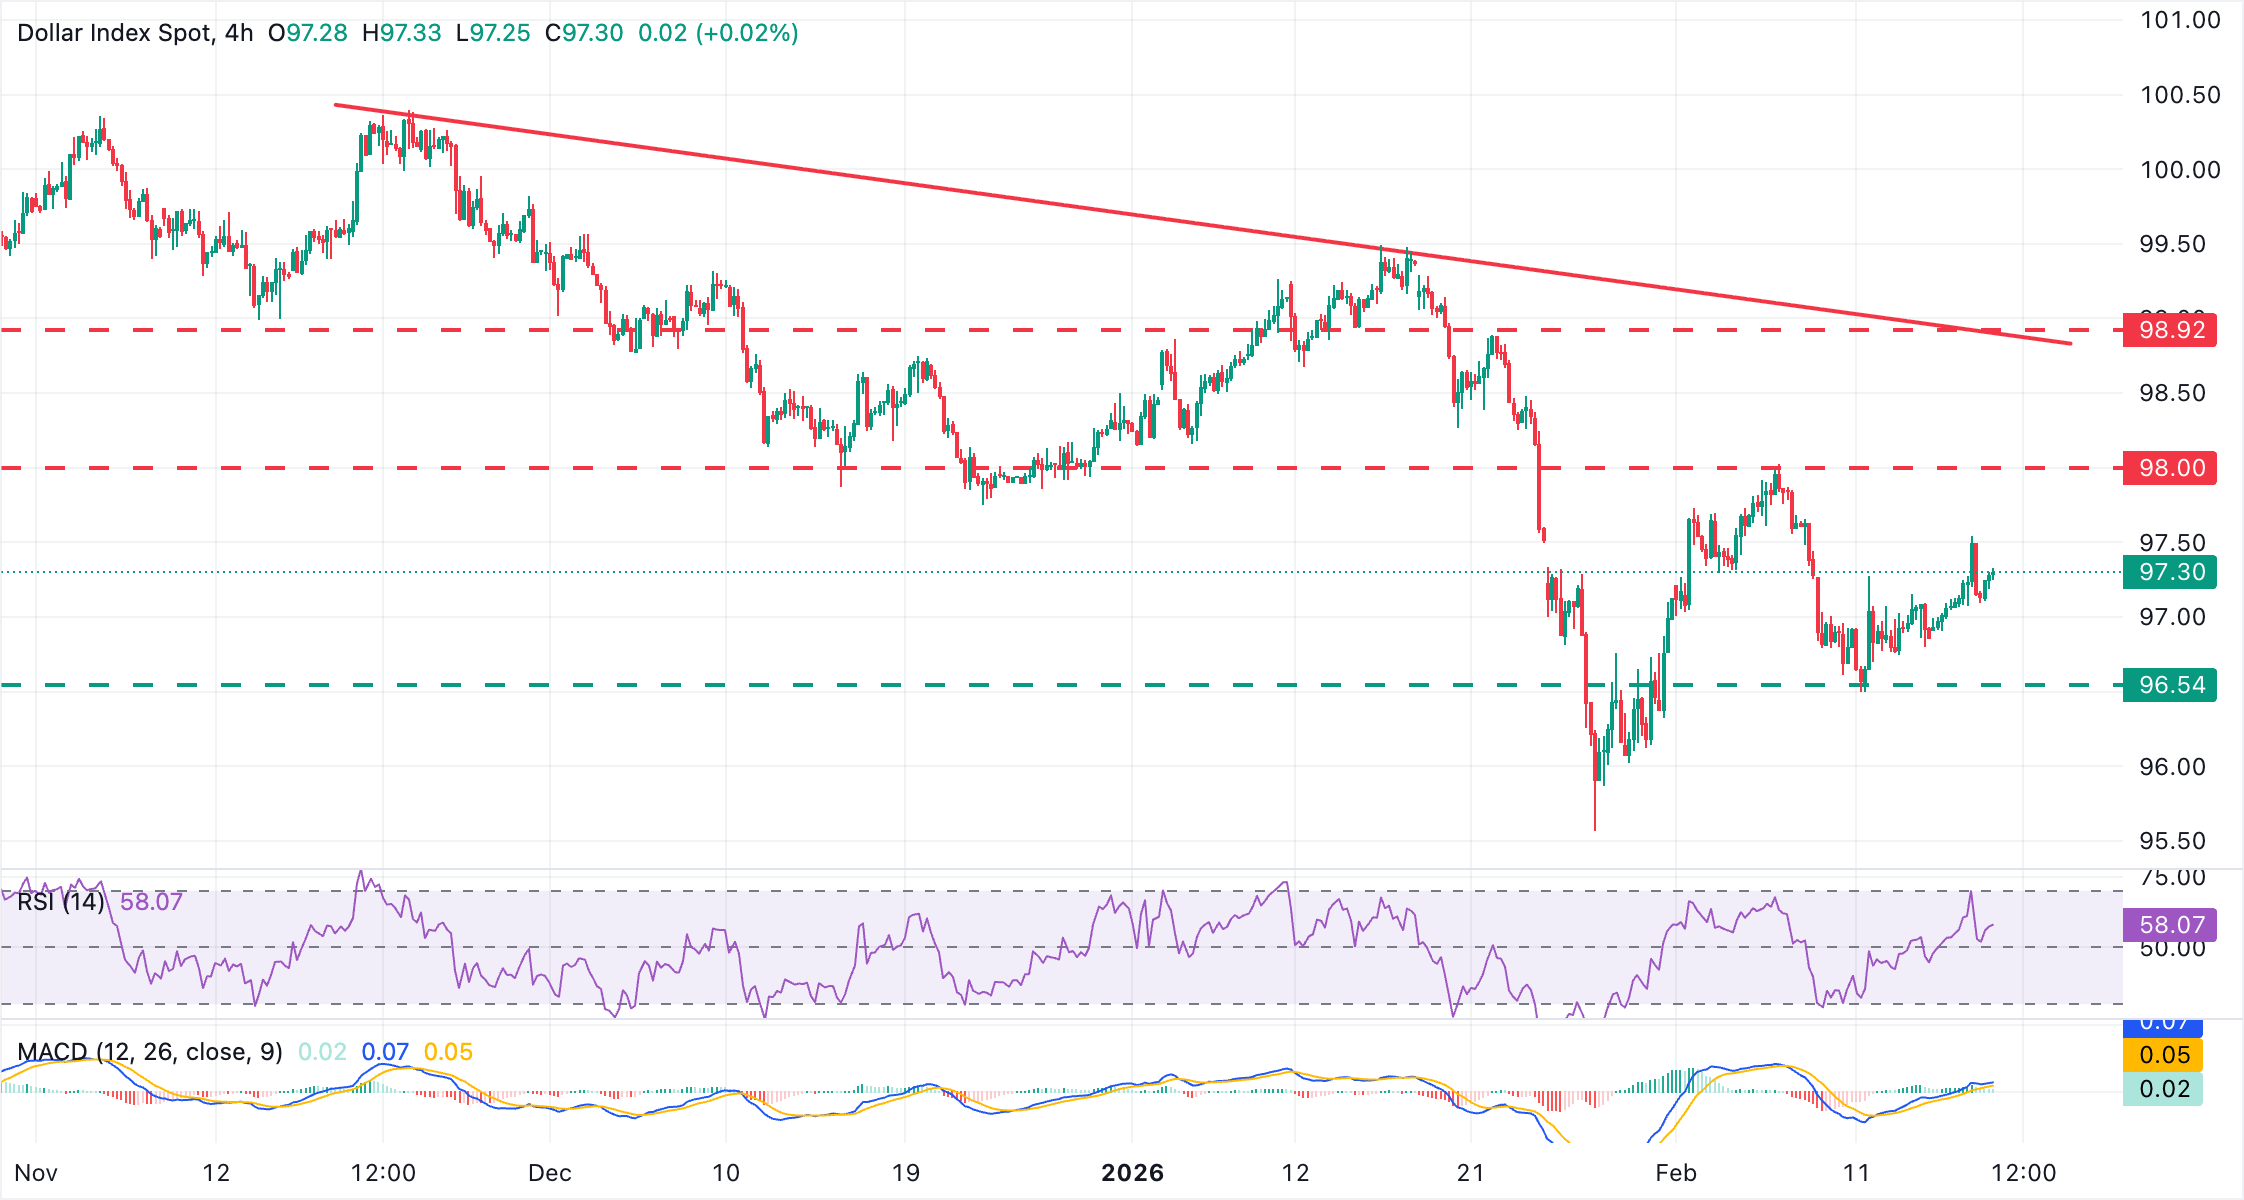
Guillermo Alcalá, FX analyst at FXStreet.com, sees the higher low of the US Dollar Index (DXY) at the 96.50 area as a potential sign of bottoming, although bullish momentum remains tentative while below the 98.00 area: “Last week’s higher low at 96.50 is a good sign for the US Dollar, but bulls would need to break and hold above the 98.00 level to confirm a trend shift and set sail for the 98.85 area, where a descending trendline resistance meets the January 21 and 22 highs.”
“A combination of undershoot GDP growth and soft inflationary pressures, on the other hand, would prompt investors to ramp up bets of Fed rate cuts for 2026 and undermine speculative support for the US Dollar. “A reversal below 96.50 would put bears back in control, exposing the four-year low at 95.55 hit in January,” Alcalá adds.
GDP FAQs
A country’s Gross Domestic Product (GDP) measures the rate of growth of its economy over a given period of time, usually a quarter. The most reliable figures are those that compare GDP to the previous quarter e.g Q2 of 2023 vs Q1 of 2023, or to the same period in the previous year, e.g Q2 of 2023 vs Q2 of 2022. Annualized quarterly GDP figures extrapolate the growth rate of the quarter as if it were constant for the rest of the year. These can be misleading, however, if temporary shocks impact growth in one quarter but are unlikely to last all year – such as happened in the first quarter of 2020 at the outbreak of the covid pandemic, when growth plummeted.
A higher GDP result is generally positive for a nation’s currency as it reflects a growing economy, which is more likely to produce goods and services that can be exported, as well as attracting higher foreign investment. By the same token, when GDP falls it is usually negative for the currency. When an economy grows people tend to spend more, which leads to inflation. The country’s central bank then has to put up interest rates to combat the inflation with the side effect of attracting more capital inflows from global investors, thus helping the local currency appreciate.
When an economy grows and GDP is rising, people tend to spend more which leads to inflation. The country’s central bank then has to put up interest rates to combat the inflation. Higher interest rates are negative for Gold because they increase the opportunity-cost of holding Gold versus placing the money in a cash deposit account. Therefore, a higher GDP growth rate is usually a bearish factor for Gold price.
Author

FXStreet Team
FXStreet
Composed of a group of economic journalists and FX experts, the FXStreet content team produces and oversees all content published on FXStreet. It provides a purely journalistic approach to the Forex market.