Official Trump price approaches breakout with mixed signals from traders
- Official Trump price is nearing the upper consolidation range on Friday, a breakout suggests a rally ahead.
- Mixed on-chain data signals indecision among traders and a lack of clear directional bias.
- The technicals suggest bullish continuation if TRUMP closes above key resistance.

Official Trump (TRUMP) is trading at $3.50 at the time of writing on Friday, approaching its upper consolidation range. A breakout from this range could open the door for an upside move. On-chain data shows market indecision, with balanced flows between bulls and bears, signaling a lack of clear directional bias. However, on the technical side, momentum is gradually building, with a close above key resistance suggesting gains ahead.
Mixed signals hinting at indecision among traders
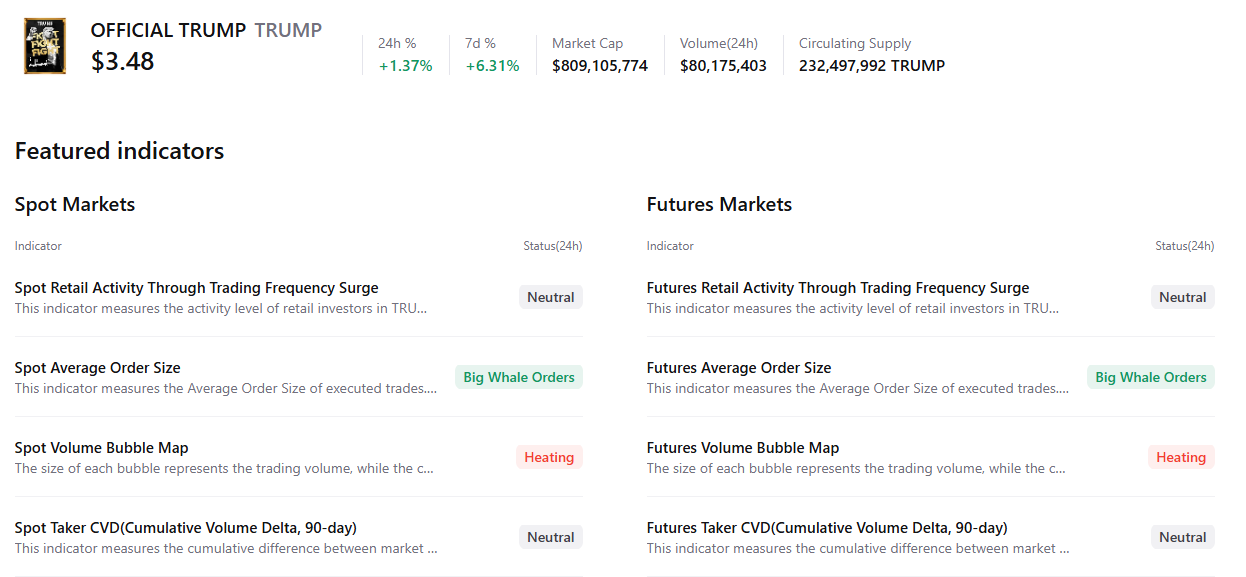
CryptoQuant’s summary data suggests that sentiment toward the TRUMP meme coin among traders is mixed. While there are large whale orders in both the spot and futures markets, suggesting bullish interest and overheating conditions, this indicates that selling pressure remains elevated. This combination suggests indecision among meme coin investors and limits the chances of a sustained breakout.
Santiment’s Supply Distribution data supports a neutral outlook for Official Trump, as certain whales are selling while others are accumulating.
The metric indicates that whales holding between 100,000 and 1 million (red line) and 10 million to 100 million (blue line) have accumulated 15.11 trillion tokens from Tuesday to Friday. During the same period, wallets holding between 1 million and 10 million TRUMP tokens (yellow line) have shed 15 trillion tokens.
This suggests a lack of unified conviction, signaling that TRUMP remains in consolidation until a clear catalyst drives a decisive directional move.
 [09-1771564490743-1771564490745.28.06, 20 Feb, 2026].png)
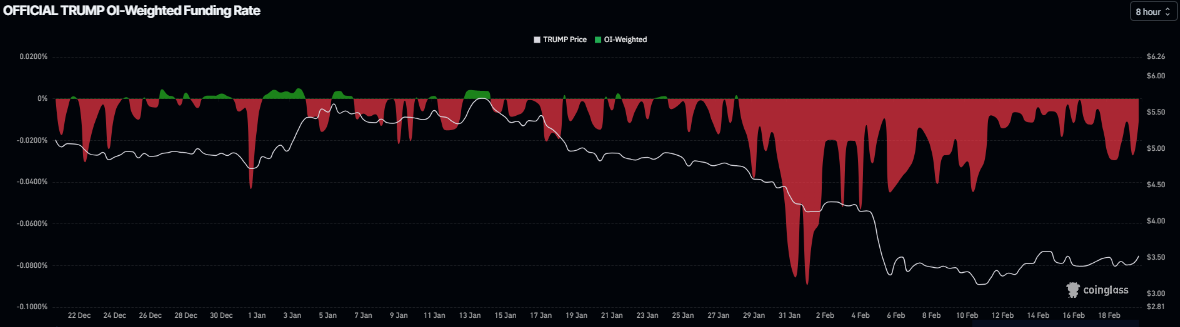
On the derivatives side, funding rates support a bearish bias. CoinGlass data shows TRUMP’s funding rate has been in a negative trend since the end of January, currently at -0.016% on Friday, indicating that short positions are paying long positions and hinting at bearish sentiment.
Official Trump Price Forecast: Breakout suggests gains ahead
Official Trump price has been trading sideways between $3.02 and $3.64 since February 6. As of Friday, TRUMP is trading higher, heading toward the upper consolidation boundary.
If TRUMP breaks and closes above the upper consolidation range at $3.64 on a daily basis, it could extend the rally toward the 50-day Exponential Moving Average (EMA) at $4.27.
The Relative Strength Index (RSI) reads 39, pointing upward toward the neutral level of 50, indicating fading bearish momentum. For the breakout rally to be sustained, the RSI must move above the neutral level. The Moving Average Convergence Divergence (MACD) showed a bullish crossover on Sunday, which remains in place, with a rising green histogram bar above the neutral level, suggesting a positive outlook.
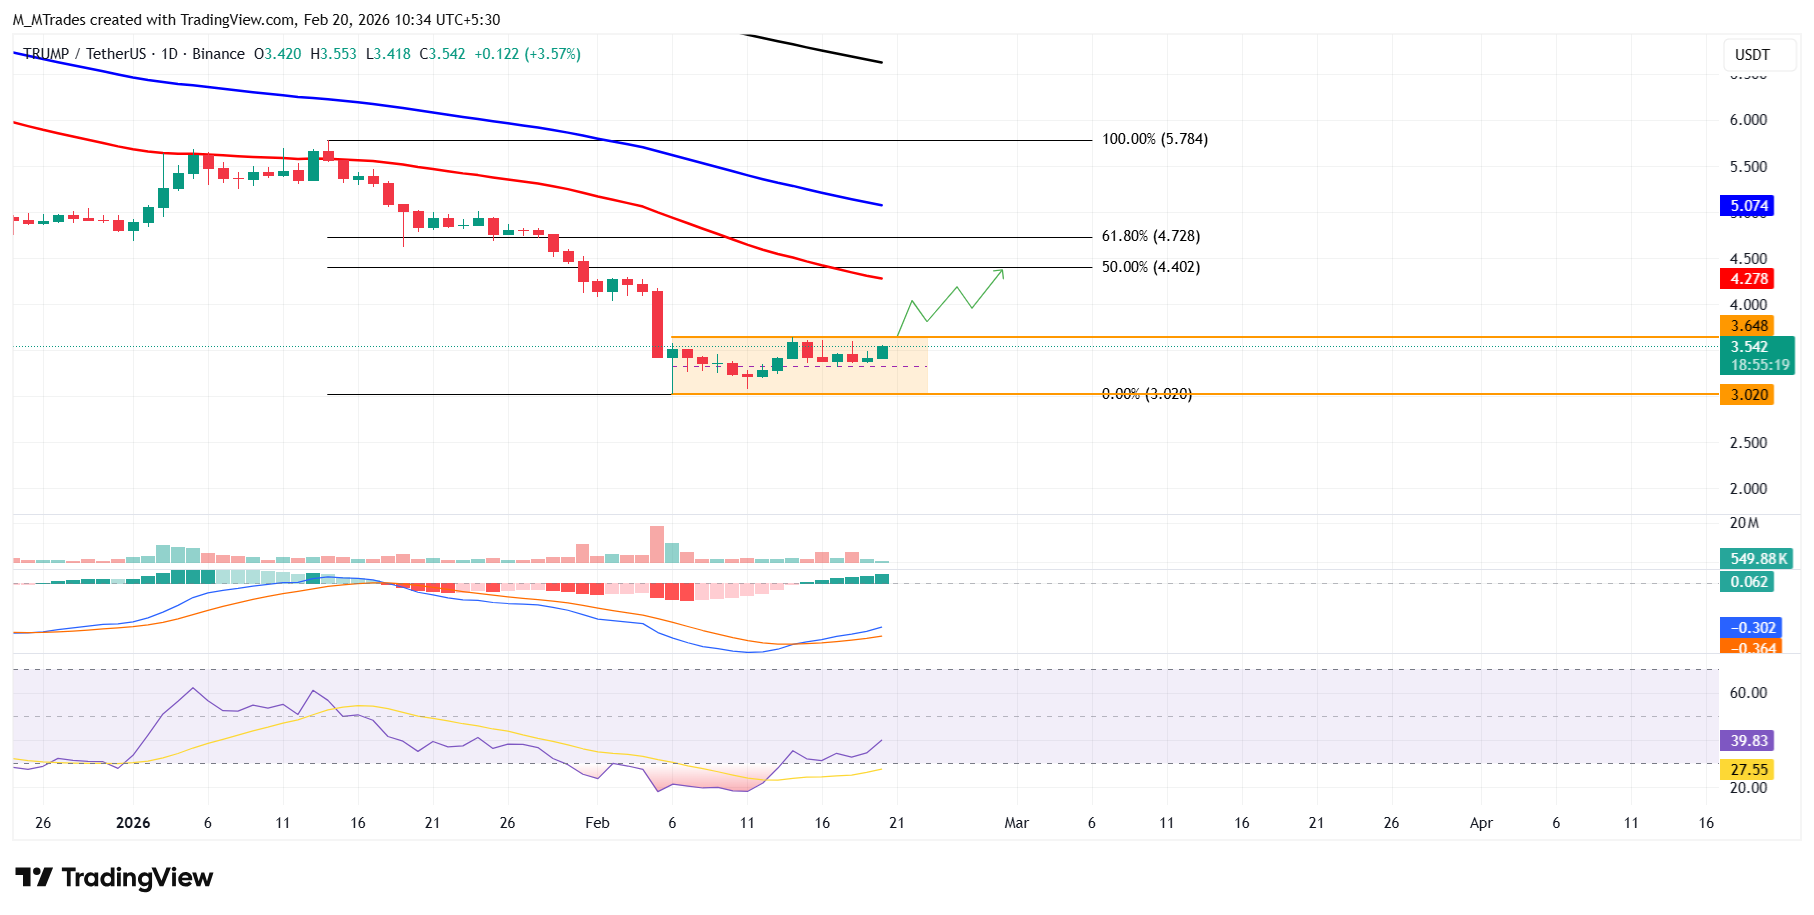
However, if TRUMP fails to close above the upper consolidation range at $3.64 and corrects, it could extend downward toward the lower consolidation range at $3.02.
Author

Manish Chhetri
FXStreet
Manish Chhetri is a crypto specialist with over four years of experience in the cryptocurrency industry.



