|

GBP/USD Price Analysis: Bears seek a break of structure while price slows below 1.2200

  • GBP/USD bulls could be tiring at this juncture.
  • Bears need to break the 1.2140 structure to cement the bearish case for the day ahead. 

GBP/USD has run up towards an area of potential resistance area on the daily chart as the following will illustrate. This gives rise to the prospects of a significant correction over the coming week:

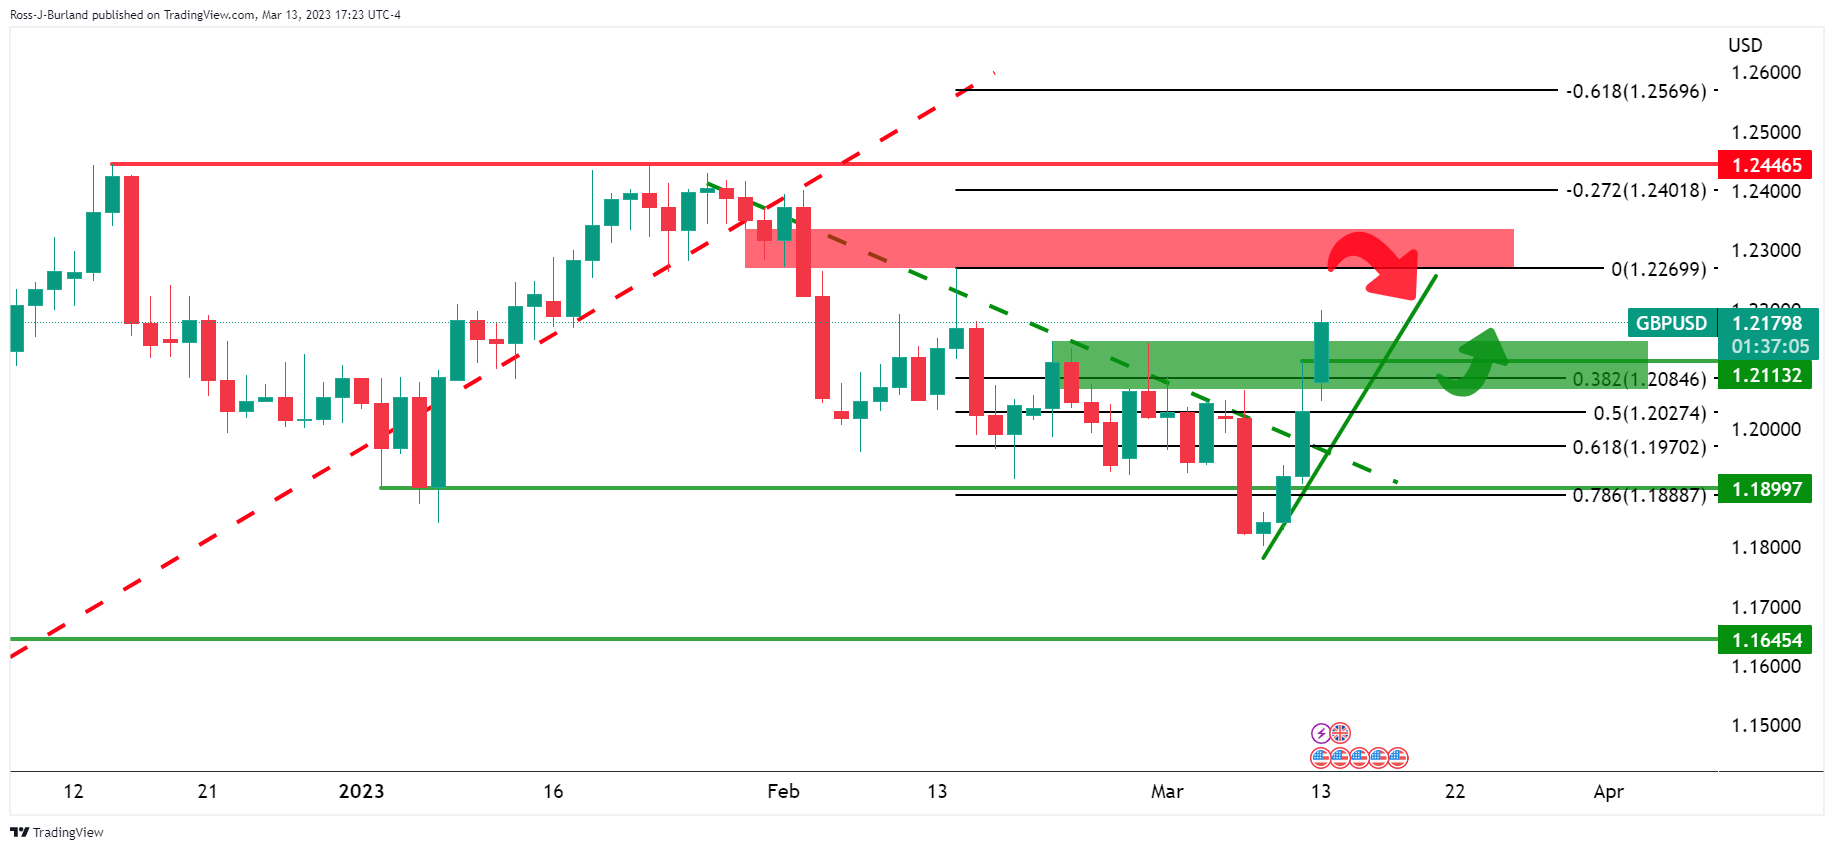
Drawing the Fibonacci from a presumed level where there could be resistance if the price were to continue higher over the next day or so, a 38.2% Fibonacci retracement level comes in near the 1.2080s as potential support. 

At this point, however, drawing the Fib from current highs, the 38.2% comes in at 1.2050. 

GBP/USD H4 chart

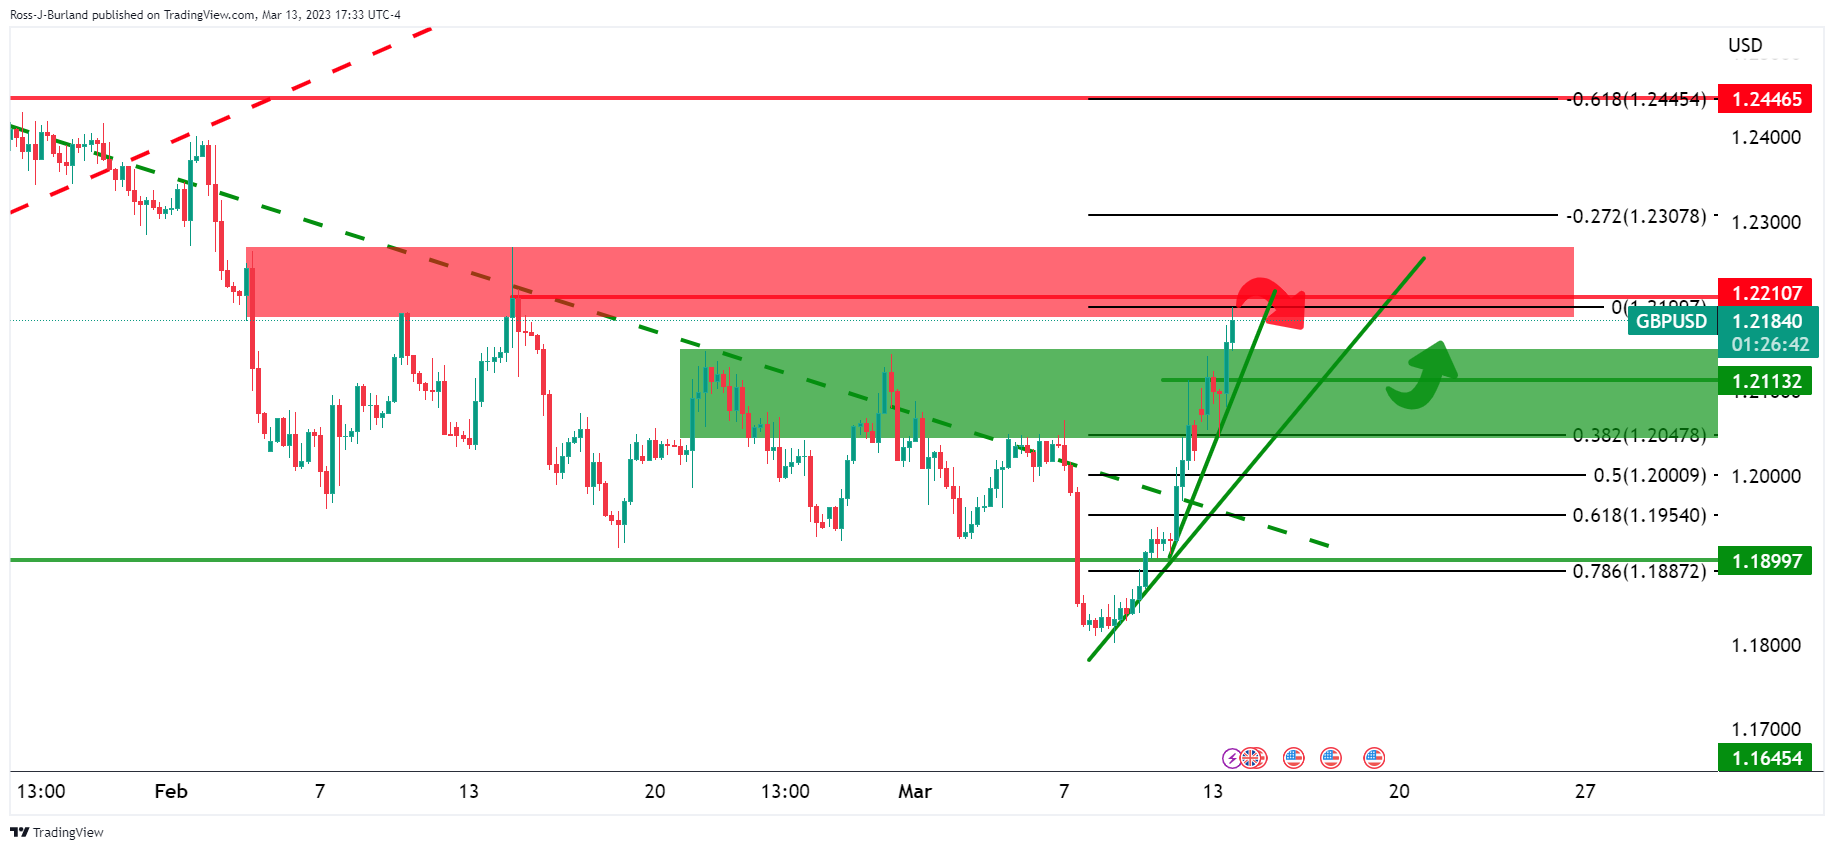
Drilling down to the 4-hour chart, above, there could be a pop to test 1.2200-1.2250 but a subsequent failure and break of the micro-dynamic support will possibly lay the foundations for the anticipated correction.

GBP/USD H1 chart

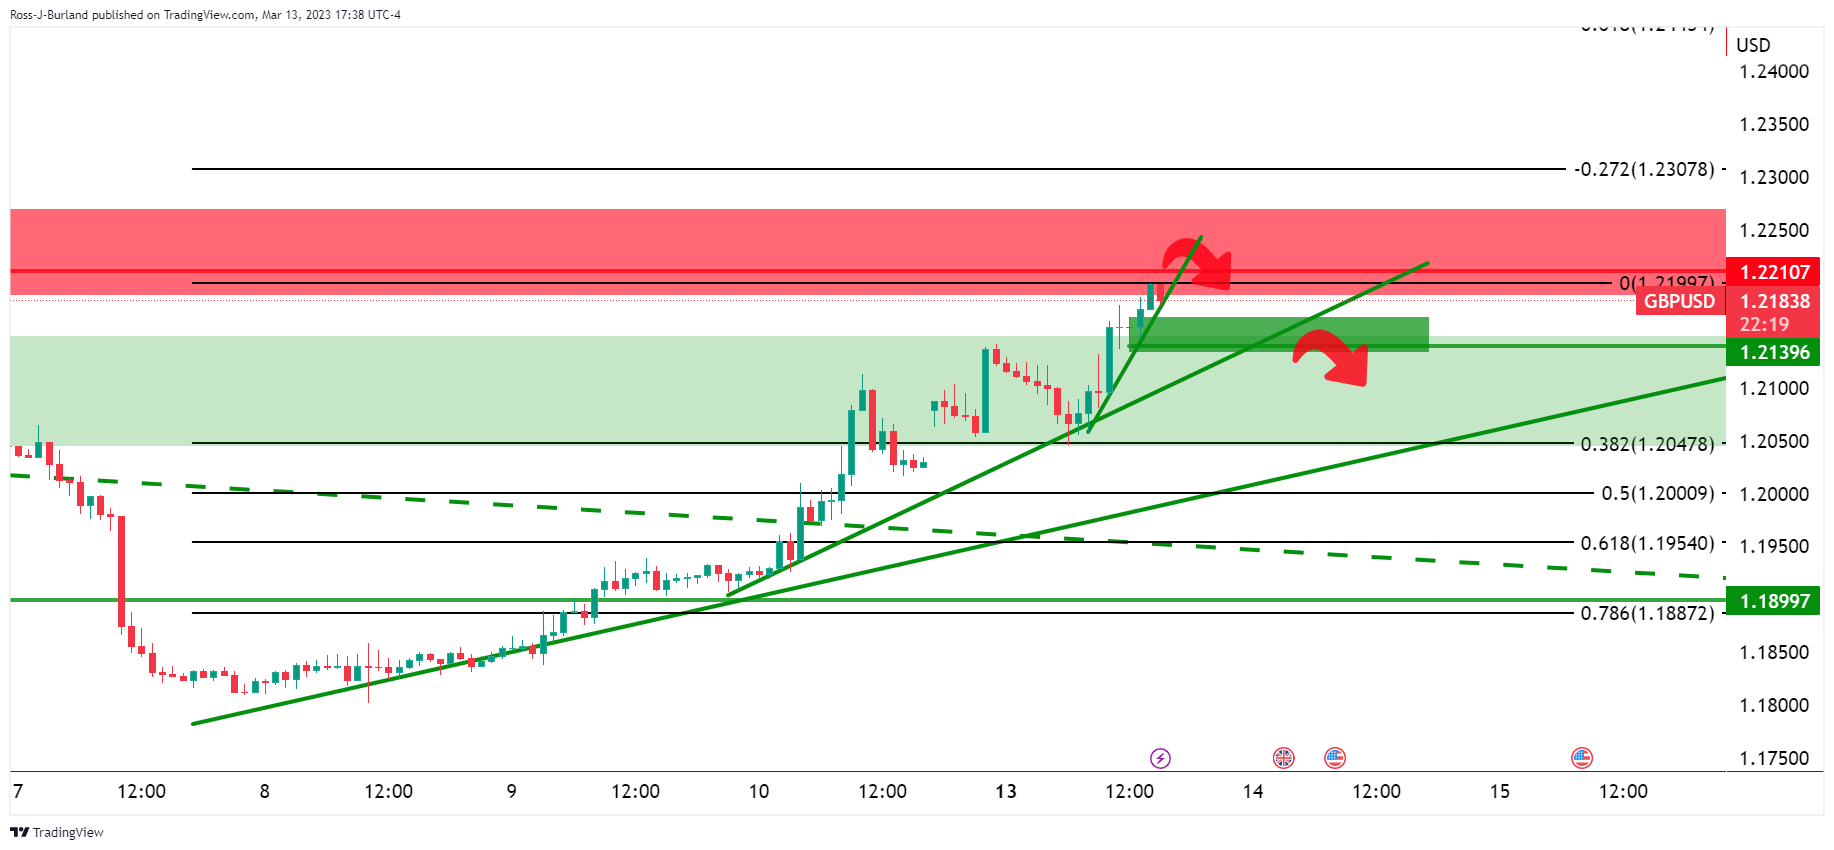
Meanwhile, the price is still very much on the front side of the trend. However, the hourly micro trendline is now under some pressure adding substance to the corrective bias at this point. A break of the 1.2140 structure is needed to cement the bearish case for the day ahead. 

Author

Ross J Burland

Ross J Burland, born in England, UK, is a sportsman at heart. He played Rugby and Judo for his county, Kent and the South East of England Rugby team.

More from Ross J Burland
Share:

Editor's Picks

EUR/USD gathers strength to near 1.1550 ahead of ECB rate decision

The EUR/USD pair trades in positive territory near 1.1540 during the early Asian trading hours. Rising bets that the European Central Bank will deliver a rate hike at its June policy meeting later on Thursday underpin the Euro against the Greenback.

GBP/USD nudges higher above 1.3350 despite rising Fed hike bets

The GBP/USD pair gathers strength to around 1.3385 during the Asian trading hours on Thursday. However, the potential upside might be limited amid rising expectations for higher-for-longer US interest rates. Markets might turn cautious later in the day ahead of the US Producer Price Index report.

Gold steadies above YTD low on softer USD; bearish bias remains amid Fed hike bets

Gold fades a modest Asian session bounce to the $4,118 region, though it manages to hold above the lowest level since November 2025. A softer Core US Consumer Price Index eased concerns about a runaway inflation spiral, weighing on the US Dollar and prompting some intraday short-covering around the precious metal.

Crypto Overview: Bitcoin consolidates above $60,000  – CRV, WLFI, XMR lead gains

The broader cryptocurrency market maintains risk-off sentiment as Bitcoin lingers above $62,000 at press time on Thursday. The mild recovery in BTC fails to lift the Fear and Greed Index, which at 15 continues to signal extreme fear among investors. Still, certain altcoins, Curve DAO, World Liberty Financial, and Monero, have emerged as top performers over the last 24 hours.

Oil is trading shadows on a radar screen

The oil market is no longer trading a clean barrel count. It is trading shadows on a radar screen, tankers running dark, missiles in the air, diplomacy wearing a flak jacket, and every macro desk trying to decide whether the Strait of Hormuz is merely impaired or about to become the fuse that relights the inflation trade.

The US economy defies the rules: 100 days into the Oil shock and the recession signal is still missing

More than three months after the start of the Iran war and the resulting disruption to global energy markets, the US economy continues to display remarkable resilience. The conflict has triggered a sharp rise in Oil prices, reignited inflationary pressures and fueled widespread concerns about a potential economic slowdown.