|

GBP/USD Price Analysis: Bears challenge 1.3800 mark amid broad-based USD strength

  • GBP/USD witnessed fresh selling on Thursday and reversed the previous day’s positive move.
  • Resurgent USD demand was seen as a key factor that exerted downward pressure on the pair.
  • Mixed technical indicators on hourly/daily charts warrant some caution for aggressive traders.

The GBP/USD pair continued losing ground through the first half of the European session and dropped to the 1.3810 region, or fresh daily lows in the last hour.

Resurgent US dollar demand was seen as a key factor that prompted fresh selling around the GBP/USD pair on Thursday. Despite signs of inflationary pressure in the US, investors seem convinced about an imminent Fed taper announcement later this year. This, along with a modest pickup in the US Treasury bond yields and the prevalent cautious mood, underpinned the safe-haven greenback.

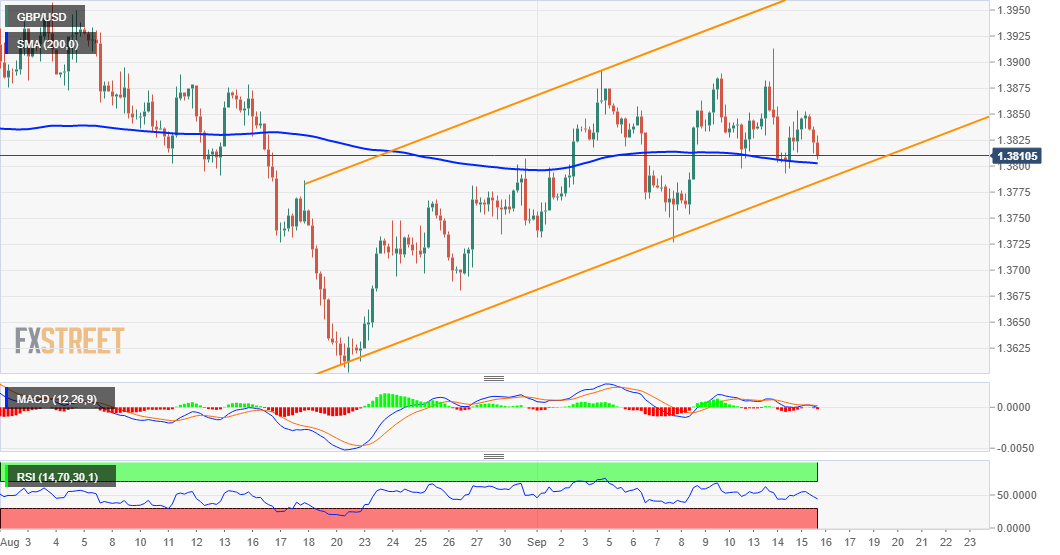
Looking at the technical picture, the GBP/USD pair has now reversed the overnight bounce from sub-1.3800 levels, or weekly lows and was last seen hovering near the 200-period SMA on the 4-hour chart. This is closely followed by support marked by the lower end of an ascending channel, extending from August monthly swing lows, which should now act as a key pivotal point for traders.

Meanwhile, oscillators on hourly charts have been gaining negative traction but are yet to confirm a bearish bias on the daily chart. This makes it prudent to wait for a convincing break below the channel support, currently around the 1.3785 area, before positioning for any further decline. The GBP/USD pair might then slide to the 1.3735 intermediate support en-route the 1.3700 mark.

On the flip side, the 1.3850-55 region now seems to have emerged as immediate strong resistance. This is followed by the 1.3885-90 supply zone and the 1.3900 mark, which if cleared decisively will negate the negative outlook. Some follow-through buying beyond the mentioned hurdles will set the stage for a move beyond mid-1.3900s, towards reclaiming the key 1.4000 psychological mark.

GBP/USD 4-hour chart

fxsoriginal

Technical levels to watch

GBP/USD

Overview
Today last price1.3809
Today Daily Change-0.0033
Today Daily Change %-0.24
Today daily open1.3842
 
Trends
Daily SMA201.3774
Daily SMA501.3808
Daily SMA1001.3915
Daily SMA2001.3832
 
Levels
Previous Daily High1.3854
Previous Daily Low1.3792
Previous Weekly High1.3889
Previous Weekly Low1.3726
Previous Monthly High1.3958
Previous Monthly Low1.3602
Daily Fibonacci 38.2%1.383
Daily Fibonacci 61.8%1.3816
Daily Pivot Point S11.3805
Daily Pivot Point S21.3768
Daily Pivot Point S31.3744
Daily Pivot Point R11.3866
Daily Pivot Point R21.389
Daily Pivot Point R31.3927

Author

Haresh Menghani

Haresh Menghani is a detail-oriented professional with 10+ years of extensive experience in analysing the global financial markets.

More from Haresh Menghani
Share:

Editor's Picks

AUD/USD looks weaker, focus is back to 0.7100

AUD/USD reverses Tuesday’s gains and retreats markedly toward four-day troughs in the low 0.7100s ahead of the opening bell in Asia. The firmer tone in the Greenback weighs on the risk complex amid unabated tensions on the US-Iran front, prompting the Aussie to shed part of recent gains and refocus on the downside. Moving forward, Australian trade balance results should entertain investors early on Thursday.

Japanese Yen bounces up from lows after Japan PM Takaichi’s intervention warnings

The Japanese Yen bounced up from five-week lows against the US Dollar, turning positive on the daily chart, as Japan’s Prime Minister Sanae Takaichi warned that Tokyo is ready to take action against Yen weakness. The USD/JPY pair has pulled back from the 160.00 level, considered a line in the sand for Japanese authorities, to hit session lows at 159.55.

Gold remains under bearish pressure, looks at $4,400

Gold keeps the offered stance well in place, retreating toward the $4,430 region per troy ounce, or four-day lows, on Wednesday. The yellow metal’s retracement comes in response to escalating tensions in the Middle East, which in turn continue to drive oil prices higher while reinforcing the idea of a tighter-for-longer Fed.


XRP eyes rebound despite muted ETF demand
Ripple (XRP) rebounds above $1.23 from support at $1.20 at the time of writing on Wednesday, as the broader cryptocurrency market pares losses triggered by escalating tensions in the Middle East. Appetite for risk assets remains generally low as the United States (US) and Iran exchange fire amid a fragile ceasefire and peace negotiations.
The upside-down math of debt
In 2010, Professors Carmen Reinhart and Kenneth Rogoff published a paper, Growth in a Time of Debt, which instantly went viral. The main thesis of the paper was that once a government's debt-to-GDP ratio crosses above 90%, a financial crisis and default are around the corner.
Recession on paper: What really moves the Canadian Loonie now?

Statistics Canada handed the headline writers a gift and the analysts a headache. Real GDP shrank 0.1% on an annualized basis in the first quarter, and with the fourth quarter of 2025 revised down to a 1.0% contraction, that is two negative quarters in a row, the textbook definition of a technical recession and Canada's first since the pandemic.