GBP/USD Price Analysis: Appreciates to near 1.2810 followed by December’s high


  • GBP/USD targets December high at 1.2828 and August high at 1.2841.
  • Technical analysis suggests a confirmation of the bullish trend for the pair.
  • The psychological level of 1.2800 appears as an immediate support level.

GBP/USD seems to continue its winning streak that began on March 1, hovering around 1.2810 during the Asian session on Friday. The GBP/USD pair receives upward support as the US Dollar (USD) faces challenges on improved risk appetite amid lower US Treasury yields.

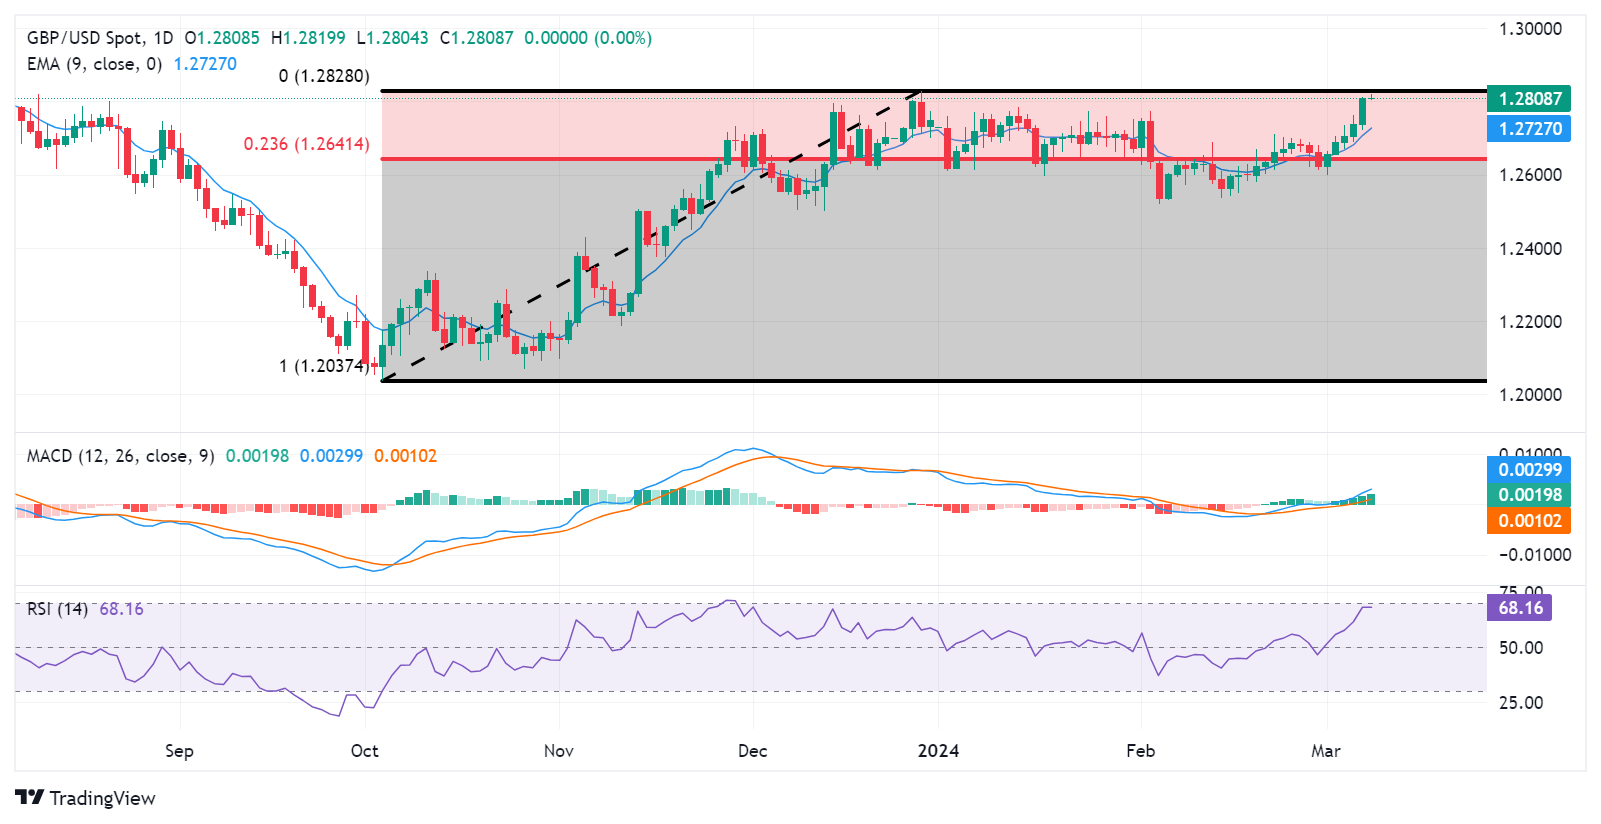
The GBP/USD pair finds the immediate barriers at December’s high at 1.2828 and August’s high at 1.2841. A break above these levels could support the pair to test the major level of 1.2850, followed by the psychological resistance area around the 1.2900 level.

The technical analysis of the GBP/USD pair shows that the 14-day Relative Strength Index (RSI) is positioned above 50. This indicates a bullish momentum for the pair. Additionally, the Moving Average Convergence Divergence (MACD), a lagging indicator, suggests a confirmation of the bullish trend for the pair. This is evident from the MACD line being situated above the centerline and shows the divergence above the signal line.

The GBP/USD pair may encounter immediate support at the psychological level of 1.2800 following further support near the major level at 1.2750. A break below the major level could push the pair to test the nine-day Exponential Moving Average (EMA) at 1.2726.

Further support lies at the psychological level of 1.2700, a surpassing of this level could lead the GBP/USD pair to test the 23.6% Fibonacci retracement level of 1.2641.

GBP/USD: Daily Chart

GBP/USD

Overview
Today last price 1.2807
Today Daily Change -0.0002
Today Daily Change % -0.02
Today daily open 1.2809
 
Trends
Daily SMA20 1.2652
Daily SMA50 1.2674
Daily SMA100 1.2576
Daily SMA200 1.2583
 
Levels
Previous Daily High 1.2811
Previous Daily Low 1.2723
Previous Weekly High 1.27
Previous Weekly Low 1.26
Previous Monthly High 1.2773
Previous Monthly Low 1.2518
Daily Fibonacci 38.2% 1.2777
Daily Fibonacci 61.8% 1.2757
Daily Pivot Point S1 1.2751
Daily Pivot Point S2 1.2693
Daily Pivot Point S3 1.2663
Daily Pivot Point R1 1.2839
Daily Pivot Point R2 1.2869
Daily Pivot Point R3 1.2927


Share: Feed news

Information on these pages contains forward-looking statements that involve risks and uncertainties. Markets and instruments profiled on this page are for informational purposes only and should not in any way come across as a recommendation to buy or sell in these assets. You should do your own thorough research before making any investment decisions. FXStreet does not in any way guarantee that this information is free from mistakes, errors, or material misstatements. It also does not guarantee that this information is of a timely nature. Investing in Open Markets involves a great deal of risk, including the loss of all or a portion of your investment, as well as emotional distress. All risks, losses and costs associated with investing, including total loss of principal, are your responsibility. The views and opinions expressed in this article are those of the authors and do not necessarily reflect the official policy or position of FXStreet nor its advertisers. The author will not be held responsible for information that is found at the end of links posted on this page.

If not otherwise explicitly mentioned in the body of the article, at the time of writing, the author has no position in any stock mentioned in this article and no business relationship with any company mentioned. The author has not received compensation for writing this article, other than from FXStreet.

FXStreet and the author do not provide personalized recommendations. The author makes no representations as to the accuracy, completeness, or suitability of this information. FXStreet and the author will not be liable for any errors, omissions or any losses, injuries or damages arising from this information and its display or use. Errors and omissions excepted.

The author and FXStreet are not registered investment advisors and nothing in this article is intended to be investment advice.

Recommended content


Recommended content

Editors’ Picks

GBP/USD rises to near 1.2540, driven by higher UK GDP

GBP/USD rises to near 1.2540, driven by higher UK GDP

GBP/USD edged higher to near 1.2540 during Asian hours on Friday, buoyed by the release of higher-than-expected UK Gross Domestic Product (GDP) data for the first quarter.

GBP/USD News

EUR/USD: The crucial resistance level will emerge at the 1.0790–1.0800 region

EUR/USD: The crucial resistance level will emerge at the 1.0790–1.0800 region

The EUR/USD pair trades on a softer note near 1.0775 during the early European hours on Friday. The downtick of the major pair is supported by the renewed US Dollar demand amid hawkish comments from Federal Reserve officials. 

EUR/USD News

Gold price attracts some buyers despite hawkish Fedspeak

Gold price attracts some buyers despite hawkish Fedspeak

Gold price edges higher for the second consecutive day on Friday. Weak employment data bolstered the speculation that the weakening economy would force the Fed to cut rates.

Gold News

Ethereum waiting on a bullish trigger, Consensys CEO takes a jab at the SEC

Ethereum waiting on a bullish trigger, Consensys CEO takes a jab at the SEC

Ethereum co-founder alleges that the SEC aims to stifle innovation through its enforcement actions against Ethereum-related companies. Grayscale CEO says he's optimistic the SEC would approve its spot ETH ETF application.

Read more

Rate cut optimism fuelled by higher US jobless claims

Rate cut optimism fuelled by higher US jobless claims

With Federal Reserve policy acting as the primary driver of investor sentiment in 2024, renewed optimism surrounding the possibility of rate cuts has propelled the Dow to its most significant rally since December. 

Read more

Forex MAJORS

Cryptocurrencies

Signatures