GBP/USD Price Analysis: Again fails to keep 100-day SMA breakout
- GBP/USD remains depressed after taking a U-turn from 1.2490.
- Two-week-old resistance-turned support could restrict immediate downside.
- Bulls will have to cross June 24 top to confirm further advances.

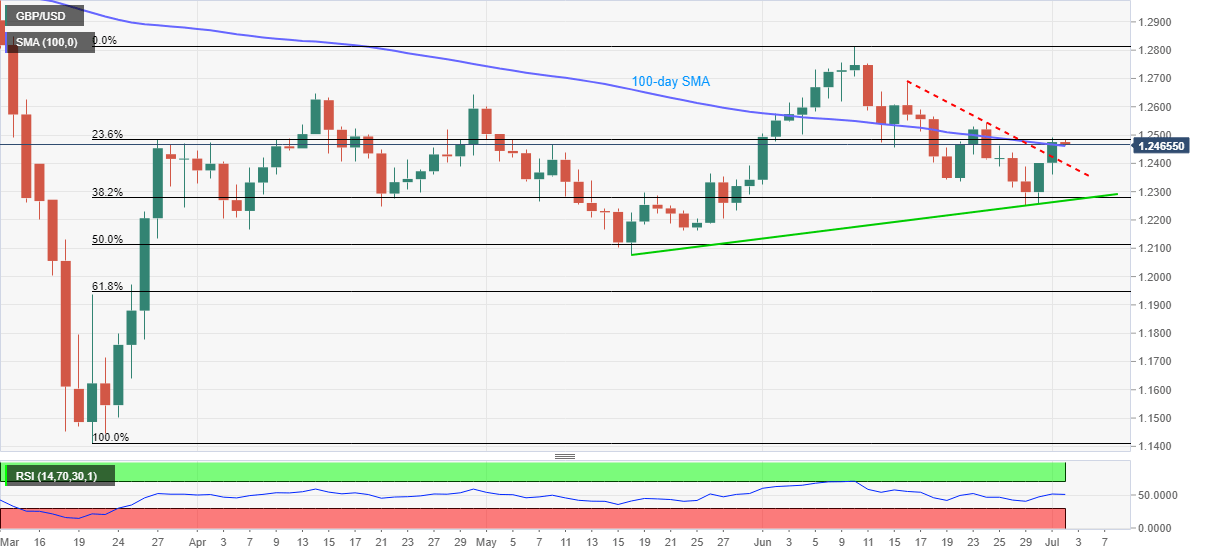
GBP/USD eases from 1.2490 to currently around 1.2465 during the initial hour of Tokyo open on Thursday. The cable takes a U-turn from one-week-old to defy its previous day’s break of 100-day SMA, which becomes frequent since the mid-June.
As a result, sellers are jostling with a 100-day SMA level around 1.2460 to revisit the falling trend line from June 16, at 1.2400 now.
It should, however, be noted that the pair’s further weakness past-1.2400 will be confined by an upward sloping trend line from May 18 and 38.2% Fibonacci retracement of March-June upside, near 1.2275/70.
Alternatively, a 23.6% Fibonacci retracement level of 1.2485 can offer immediate resistance ahead of 1.2500 and June 24 top near 1.2545.
Given the pair’s ability to cross 1.2545, it can rise towards 1.2690 and the previous month’s top of 1.2813.
GBP/USD daily chart
Trend: Pullback expected
Author

Anil Panchal
FXStreet
Anil Panchal has nearly 15 years of experience in tracking financial markets. With a keen interest in macroeconomics, Anil aptly tracks global news/updates and stays well-informed about the global financial moves and their implications.


