Silver Price Forecast: RSI stabilizes above 50, upside bias builds
- Silver edges lower on Thursday amid cautious geopolitical sentiment.
- Technically, XAG/USD maintains a mildly bullish bias above the 50-day SMA.
- A sustained move above $92.75 would confirm bullish continuation, while $85.93 remains key support on the downside.
Silver (XAG/USD) trades on the back foot on Thursday amid cautious sentiment as US-Iran nuclear talks get underway in Geneva, discouraging aggressive positioning. At the time of writing, XAG/USD trades at $86.45, remaining confined within this week’s trading range, while a firmer US Dollar (USD) caps the upside.
However, the downside appears limited as ongoing tensions in the Middle East and renewed trade jitters surrounding US trade policy keep safe-haven demand intact.
The white metal has surged over 20% in the last six trading days to its highest level in three weeks. The rebound suggests bulls are gradually regaining control following the sharp corrective pullback from the late-January record high near $121.66.
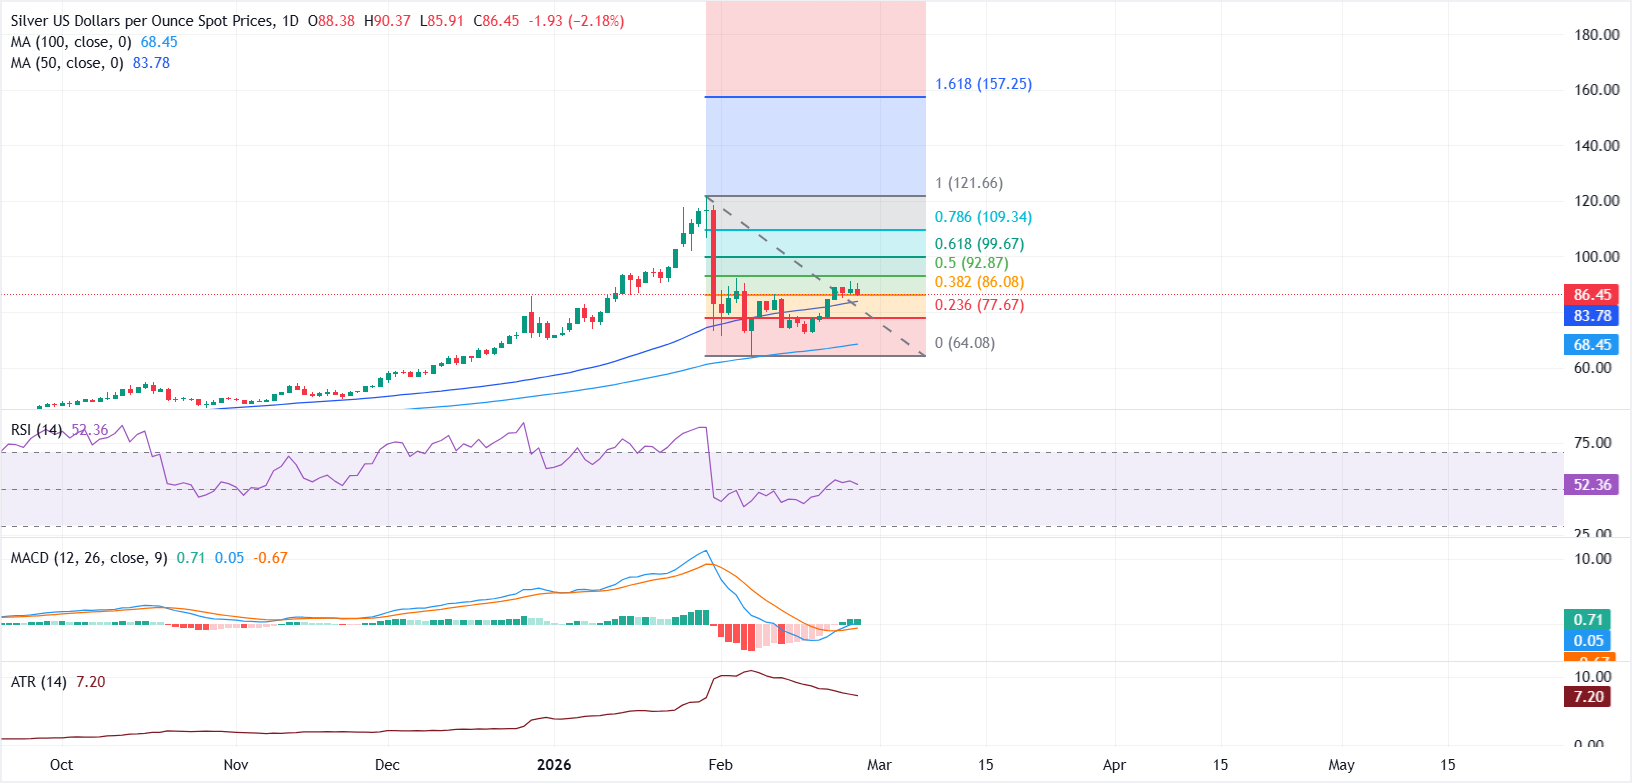
From a technical perspective, the daily chart shows a mildly bullish near-term bias. XAG/USD is attempting to build support above the rising 50-day Simple Moving Average (SMA) near $83.78 and remains well above the 100-day SMA around $68.45, keeping the broader uptrend structure intact.
The Relative Strength Index (RSI) has stabilized just above the 50 mark after recovering from mid-range levels, signaling improving momentum without yet entering overbought territory.
The Moving Average Convergence Divergence (MACD) indicator shows early signs of stabilization after the recent corrective phase. The MACD line has crossed back above the Signal line, while the histogram has shifted into positive territory, hinting at fading downside pressure but not yet signaling a strong recovery.
Meanwhile, the Average True Range (ATR) has eased from recent peaks, suggesting that the extreme volatility phase is fading and price action may transition into a steadier directional move rather than sharp swings.
On the downside, initial support emerges near the 38.2% Fibonacci retracement at $86.08, measured from the $121.66 high to the $64.08 low. A sustained break below this level could expose the 23.6% retracement at $77.67 as the next meaningful support zone.
On the upside, immediate resistance aligns with the 50% Fibonacci retracement at $92.87. A decisive close above this barrier would strengthen bullish conviction and open the door toward the 61.8% retracement at $99.67.
(The technical analysis of this story was written with the help of an AI tool.)
(This story was corrected on February 26 at 13:15 GMT to clarify that the 100-day Simple Moving Average (SMA) is located near $68.45, not in the low-to-mid $80s as previously stated.)
Silver FAQs
Silver is a precious metal highly traded among investors. It has been historically used as a store of value and a medium of exchange. Although less popular than Gold, traders may turn to Silver to diversify their investment portfolio, for its intrinsic value or as a potential hedge during high-inflation periods. Investors can buy physical Silver, in coins or in bars, or trade it through vehicles such as Exchange Traded Funds, which track its price on international markets.
Silver prices can move due to a wide range of factors. Geopolitical instability or fears of a deep recession can make Silver price escalate due to its safe-haven status, although to a lesser extent than Gold's. As a yieldless asset, Silver tends to rise with lower interest rates. Its moves also depend on how the US Dollar (USD) behaves as the asset is priced in dollars (XAG/USD). A strong Dollar tends to keep the price of Silver at bay, whereas a weaker Dollar is likely to propel prices up. Other factors such as investment demand, mining supply – Silver is much more abundant than Gold – and recycling rates can also affect prices.
Silver is widely used in industry, particularly in sectors such as electronics or solar energy, as it has one of the highest electric conductivity of all metals – more than Copper and Gold. A surge in demand can increase prices, while a decline tends to lower them. Dynamics in the US, Chinese and Indian economies can also contribute to price swings: for the US and particularly China, their big industrial sectors use Silver in various processes; in India, consumers’ demand for the precious metal for jewellery also plays a key role in setting prices.
Silver prices tend to follow Gold's moves. When Gold prices rise, Silver typically follows suit, as their status as safe-haven assets is similar. The Gold/Silver ratio, which shows the number of ounces of Silver needed to equal the value of one ounce of Gold, may help to determine the relative valuation between both metals. Some investors may consider a high ratio as an indicator that Silver is undervalued, or Gold is overvalued. On the contrary, a low ratio might suggest that Gold is undervalued relative to Silver.
Author

Vishal Chaturvedi
FXStreet
I am a macro-focused research analyst with over four years of experience covering forex and commodities market. I enjoy breaking down complex economic trends and turning them into clear, actionable insights that help traders stay ahead of the curve.


