Crypto Today: Bitcoin, Ethereum, XRP test rebound strength as ETF inflows return
- Bitcoin rises above $65,000, supported by improving risk-on sentiment and inflows into spot ETFs.
- Ethereum’s downside remains protected above $1,800 as bulls push for a breakout eyeing highs past $2,000.
- Renewed institutional interest and strong support increase the likelihood of a sustained XRP recovery.

Bitcoin (BTC), Ethereum (ETH) and Ripple (XRP) are gaining traction at the time of writing on Wednesday, amid persistent market doldrums. The Crypto King is up over 2% intraday, trading above $65,000 from the day’s opening of $64,058. Bitcoin tested support at $62,500 on Tuesday, as investors delicately navigated fresh tariff uncertainty.
Leading altcoins, Ethereum and XRP, are showing subtle signs of recovery, following Bitcoin’s lead. Ethereum hovers slightly above $1,900, as XRP inches toward the immediate $1.40 resistance.
Renewed institutional demand fuels BTC, ETH and XRP rebound
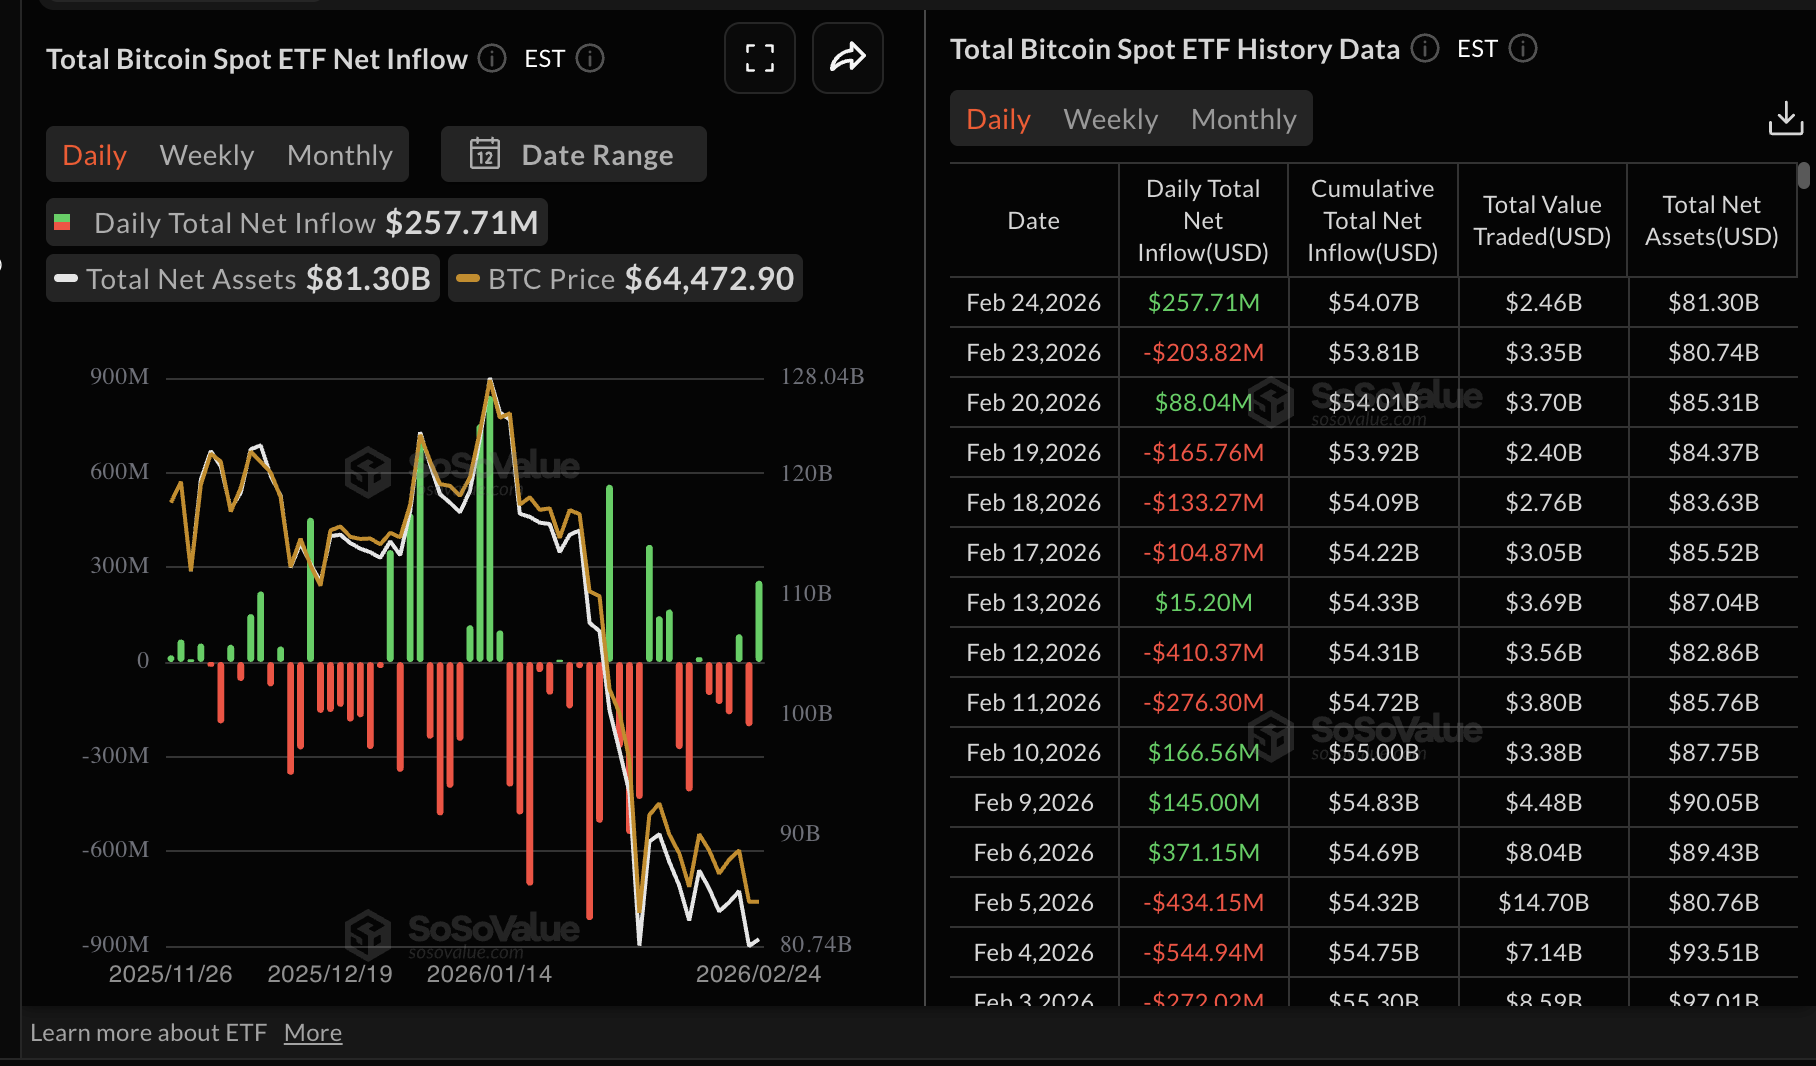
Bitcoin spot Exchange Traded Funds (ETFs) are experiencing a resurgence of institutional interest, with inflows totaling nearly $258 million on Tuesday. Fidelity’s FBTC ETF led with approximately 83 million in inflows, followed by BlackRock’s IBIT with $79 million and 21Shares' ARKB with $71 million.
Cumulative inflows stand at $54 billion, with net assets at $81 billion. Extended inflows would boost investor confidence in Bitcoin as risk appetite improves.
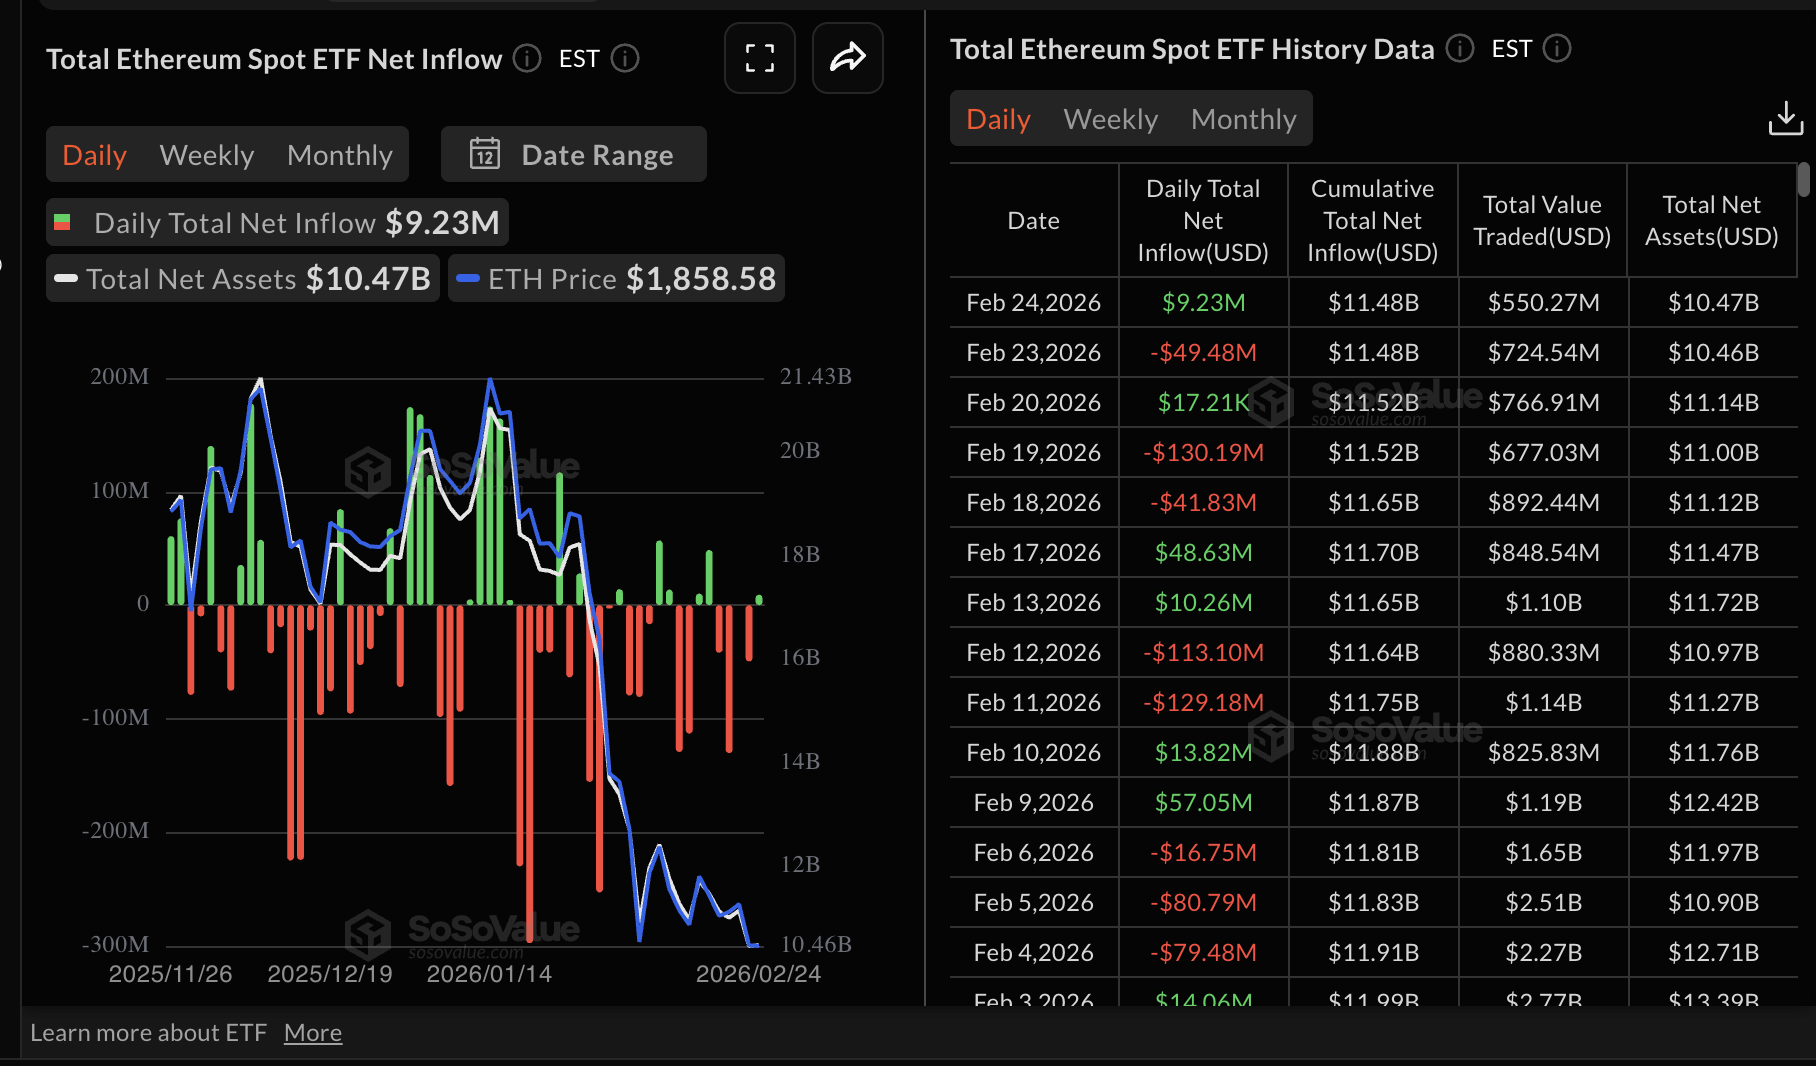
US-listed Ethereum ETFs also experienced a slight increase in investor interest, recording mild inflows of approximately $9 million on Tuesday. Grayscale’s ETH ETF accounted for all the inflows at $11 million, while Fidelity’s FETH was the only product that saw outflows of $1.9 million. Cumulative inflows stand at $11.48 million, with net assets averaging $10.47 billion.
XRP ETFs, on the other hand, recorded inflows of approximately $3 million on Tuesday after two consecutive days of muted activity. No flows were recorded on Monday or Friday, with cumulative inflows currently at $1.23 billion and net assets at $981 million.
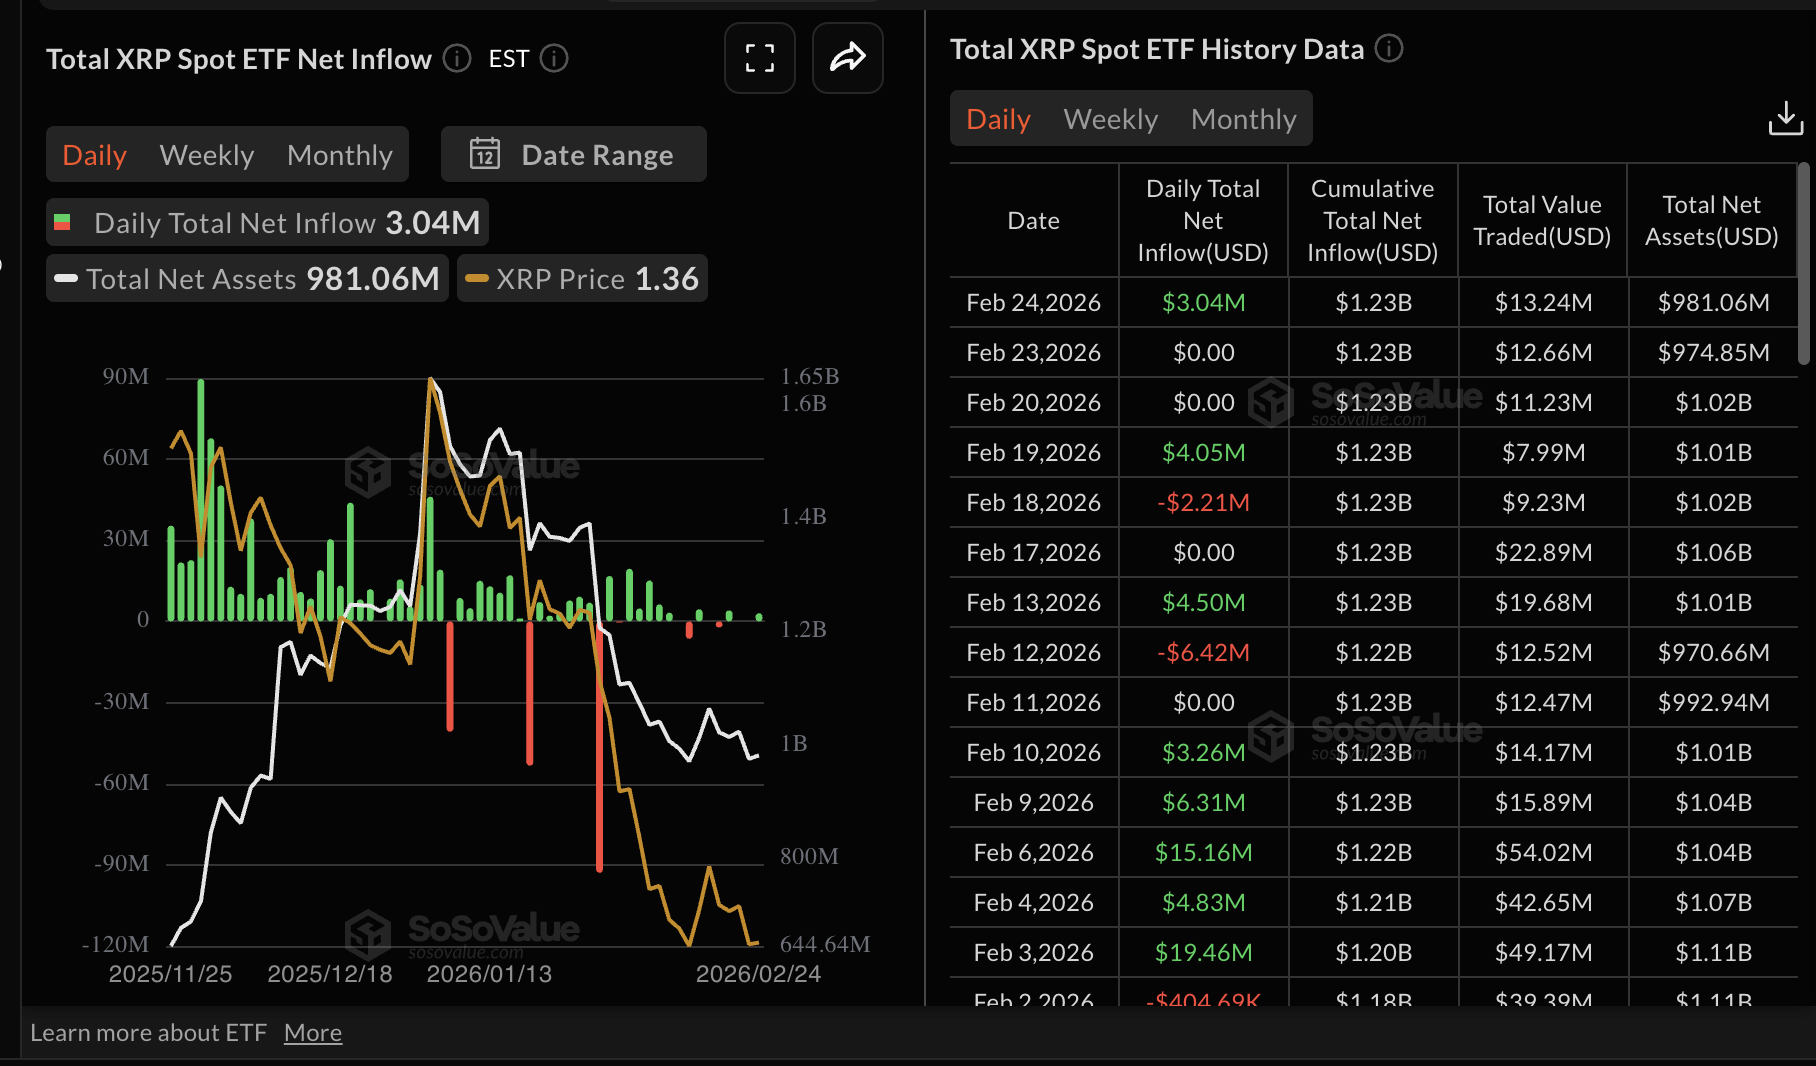
Chart of the day: Bitcoin eyes higher support
Bitcoin is trading at $65,510 at the time of writing on Wednesday, as short-term bias turns cautiously bullish after reclaiming ground above recent lows near $62,510, while the Moving Average Convergence Divergence (MACD) line holds above its signal line on the daily chart, indicating improving upside momentum.
The Relative Strength Index (RSI) at 35 stays below the 50 midline after rising from oversold territory, suggesting fading bearish pressure rather than strong buying. Meanwhile, BTC trades well beneath the 50-, 100-, and 200-day Exponential Moving Averages (EMAs), all clustered between $76,400 and $91,452, so the broader trend framework remains corrective even as downside momentum eases.
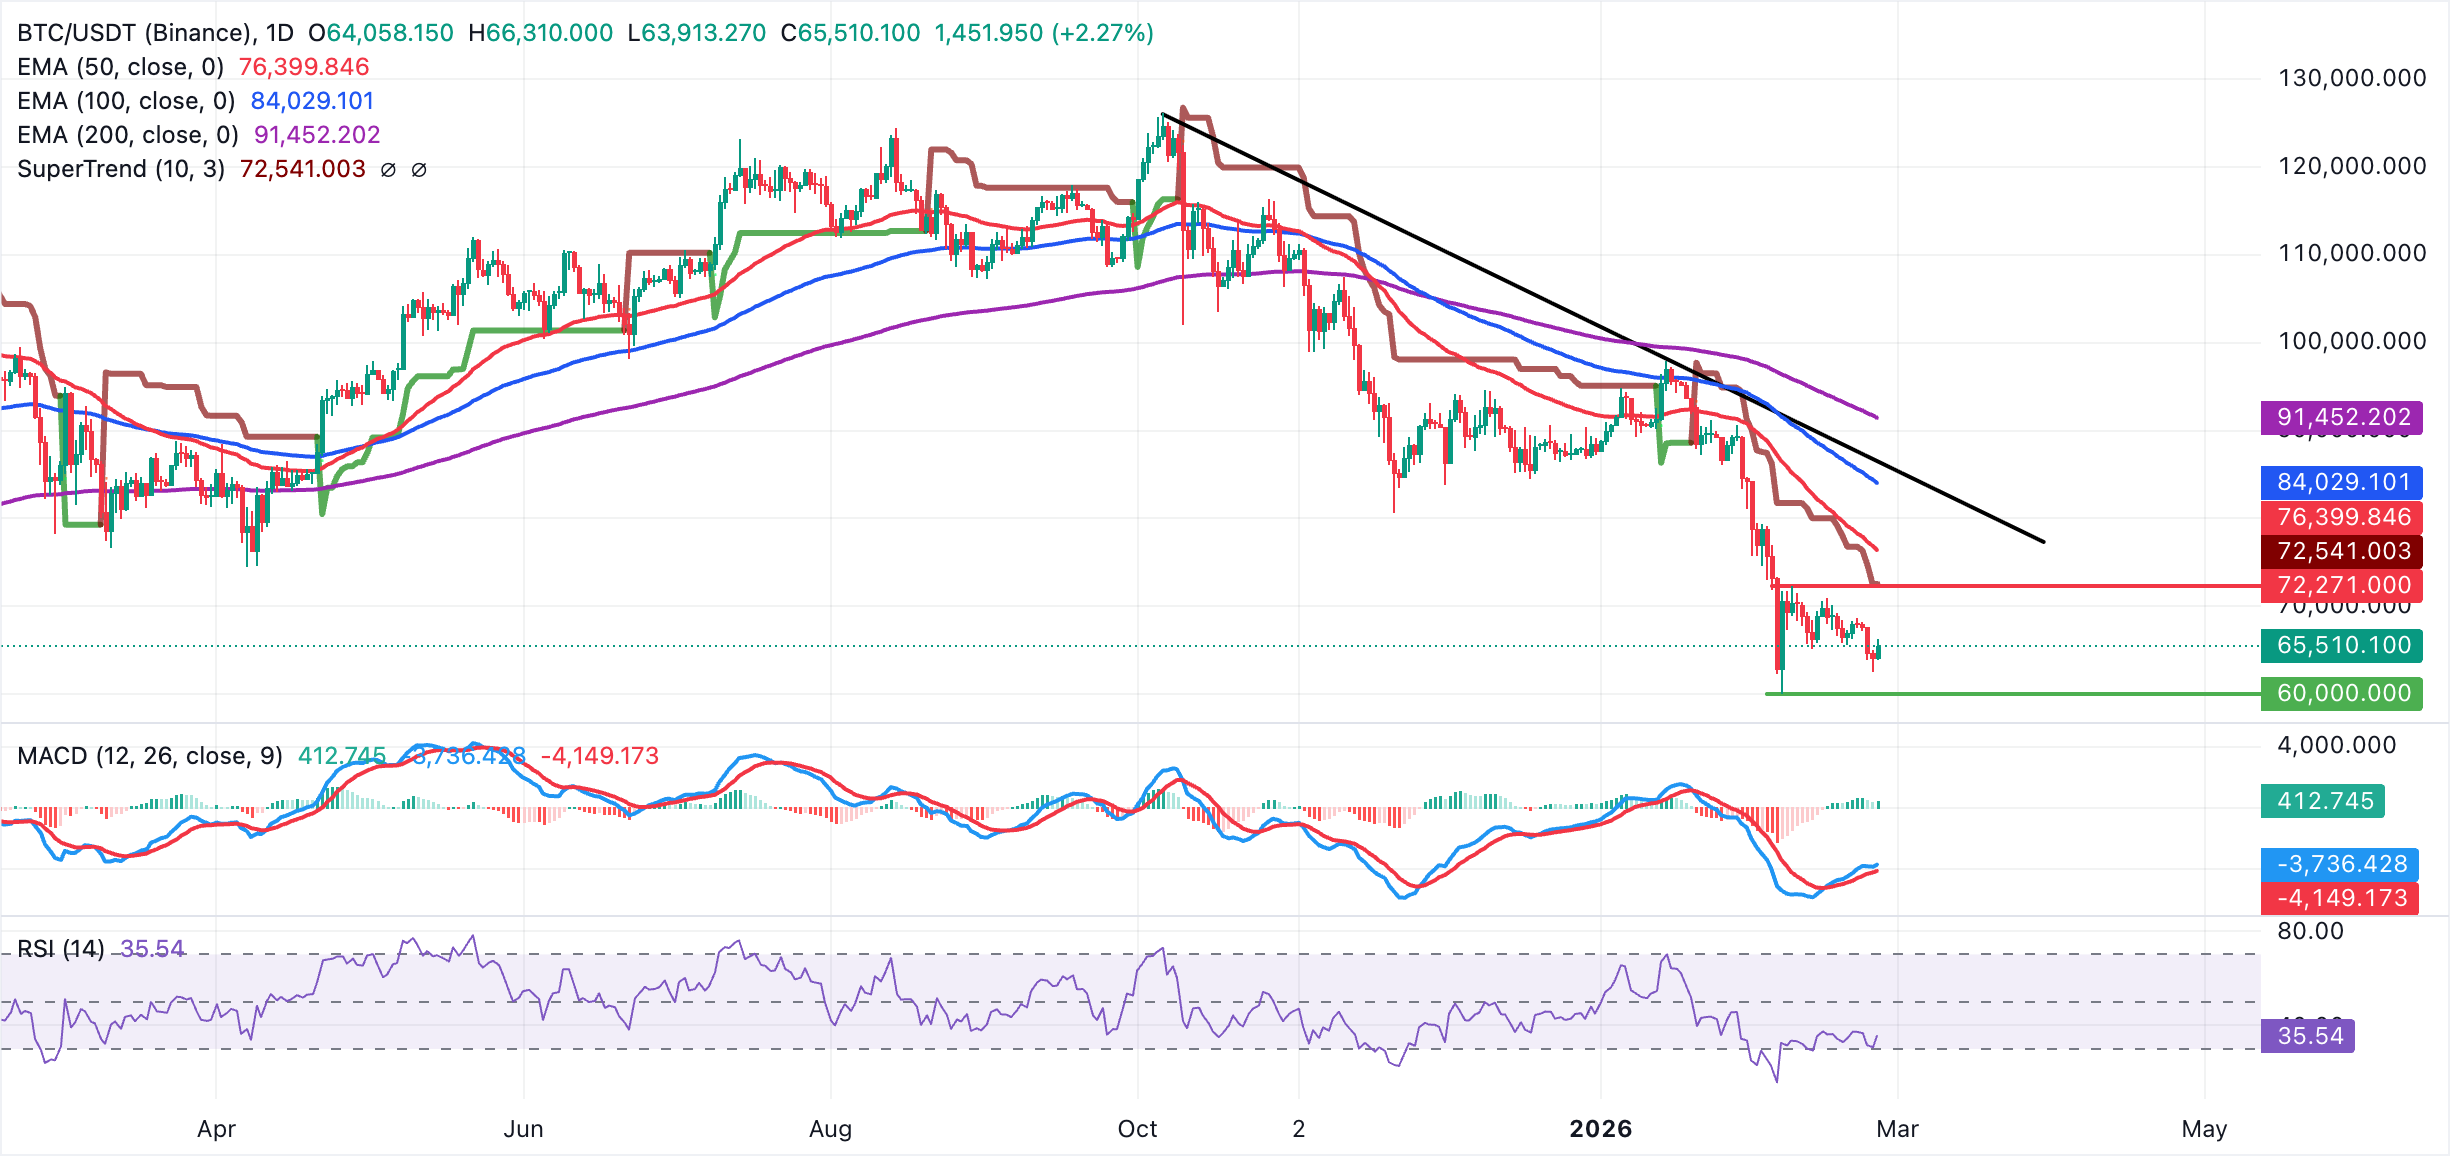
Initial resistance aligns near $70,600, where recent swing highs converge, followed by $72,271, which is the February 8 high. The SuperTrend line is around $72,500-$74,700, forming a broader supply zone.
As long as Bitcoin holds above $62,510 and momentum indicators keep firming, dips are more likely to attract buying interest within this developing recovery phase.
Altcoins update: Ethereum, XRP edge higher as technicals strengthen
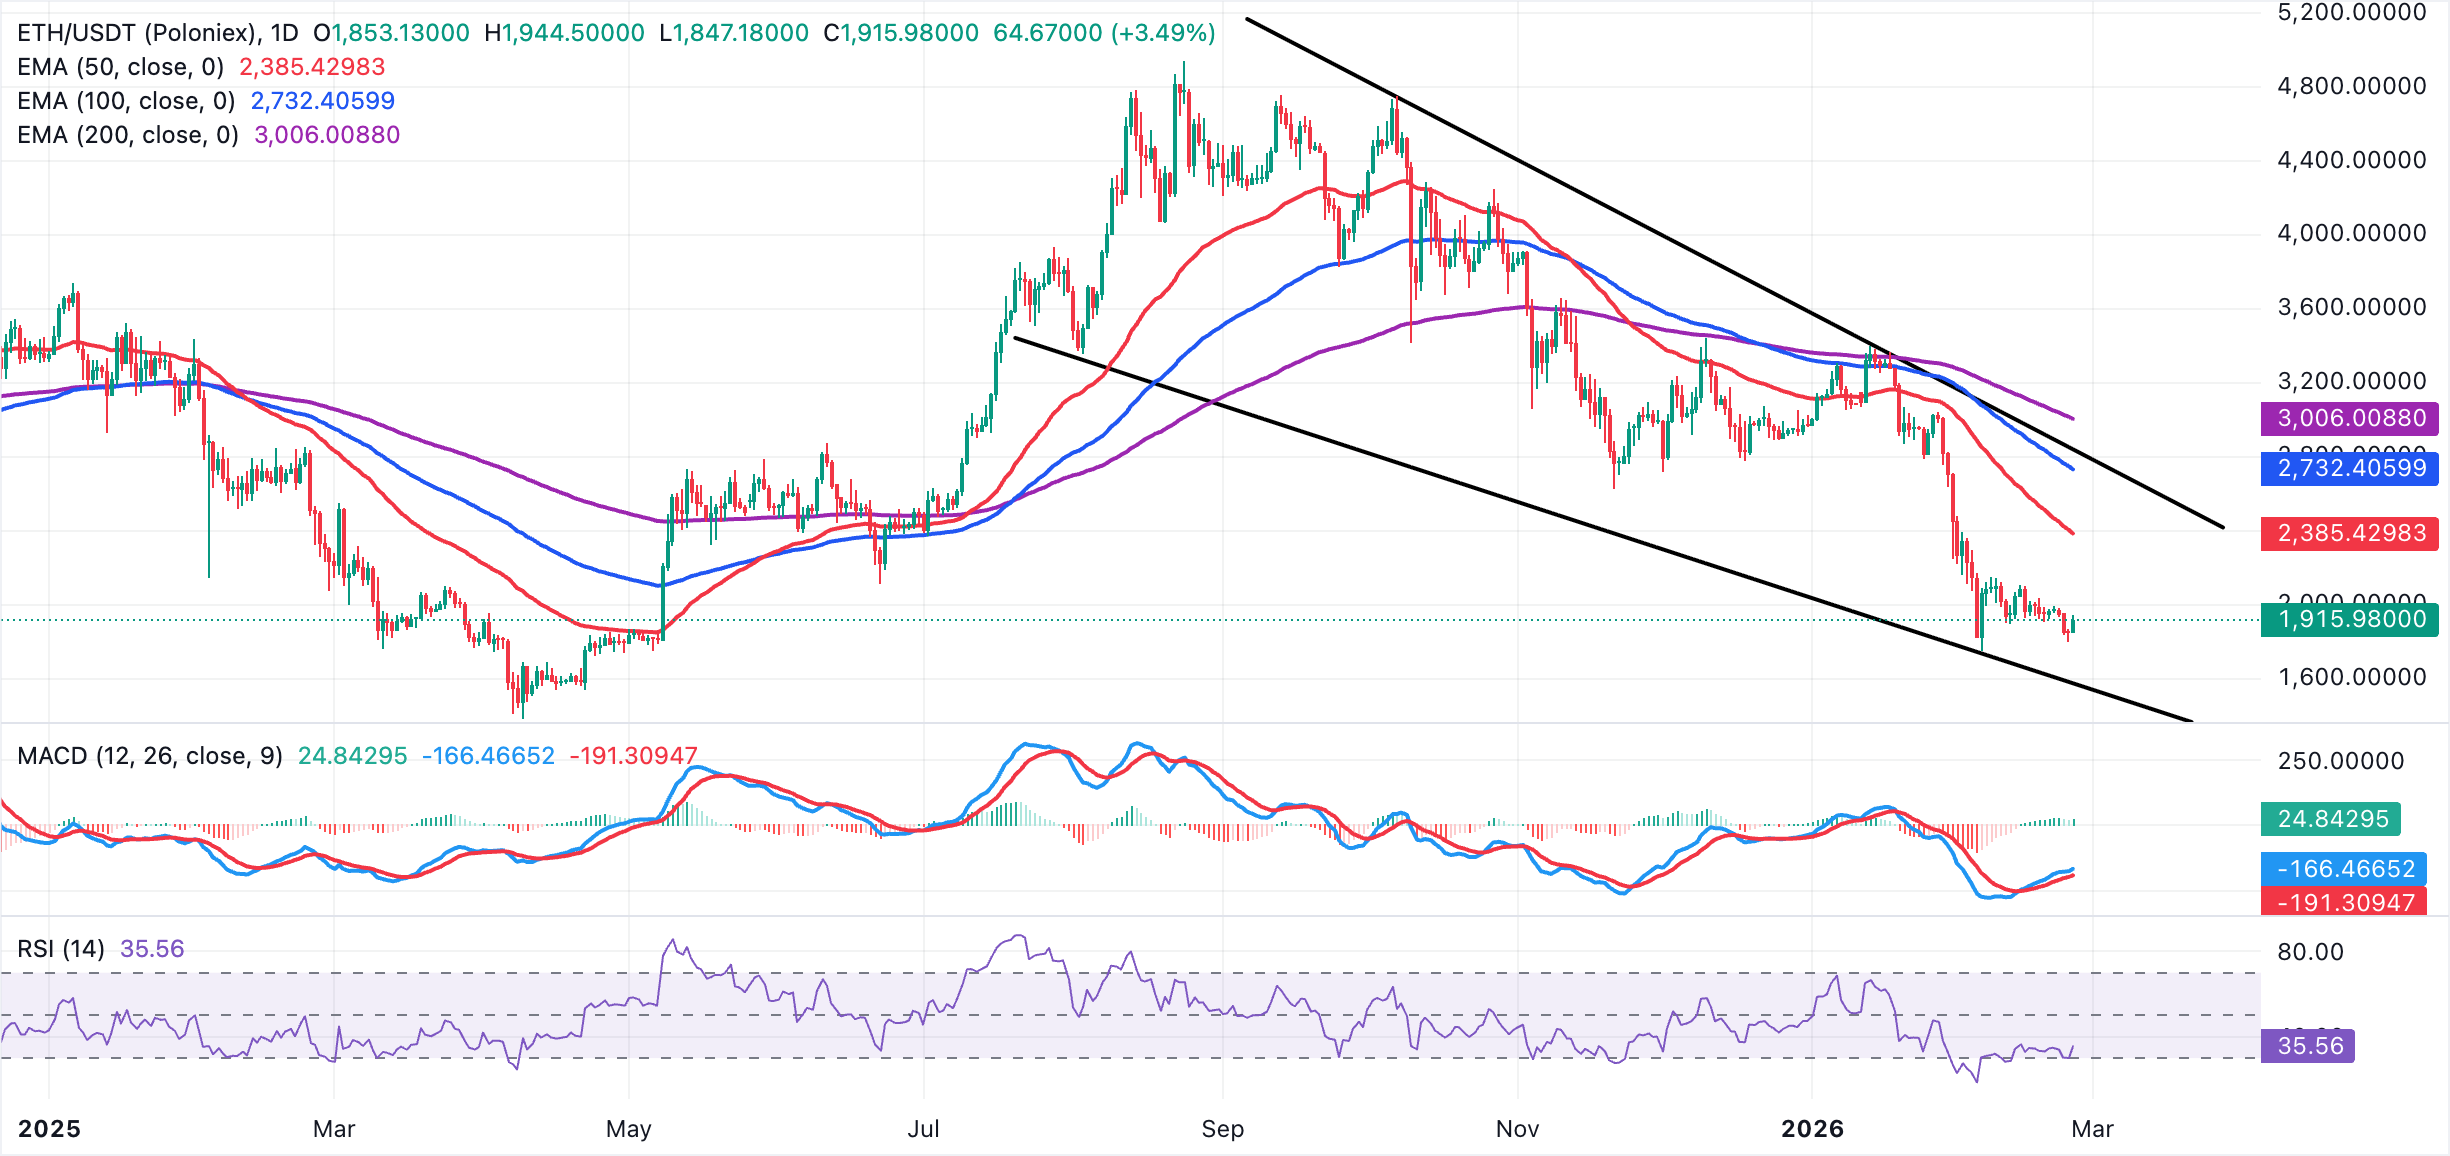
Ethereum hovers at $1,914 while holding below the 50-, 100-, and 200-day EMAs, reinforcing a dominant downside trend. A long-standing descending resistance trend line from the record high of $4,956 continues to cap recovery attempts. The MACD indicator rises above its signal line, hinting at improving, yet still fragile momentum within a broader downtrend.
At the same time, the RSI at 35 has risen from oversold territory yet remains below the 50 midline, suggesting sellers still control the trend despite a short-term bounce.
A daily close above $1,900 would be needed to challenge the bearish structure and open the way toward the 50-day EMA at $2,385.
On the downside, initial support stands at 1,800, with a break here likely exposing further downside toward the February 6 low at $1,747.
Meanwhile, XRP is trading at $1.38, holding well below the descending resistance trend line that was last rejected near $2.41 in January and continues to respect a series of lower highs.
Daily closes remain below the 50-, 100-, and 200-day EMAs, clustered between roughly $1.63 and $2.08, keeping XRP entrenched in a medium-term downtrend despite the recent stabilization.
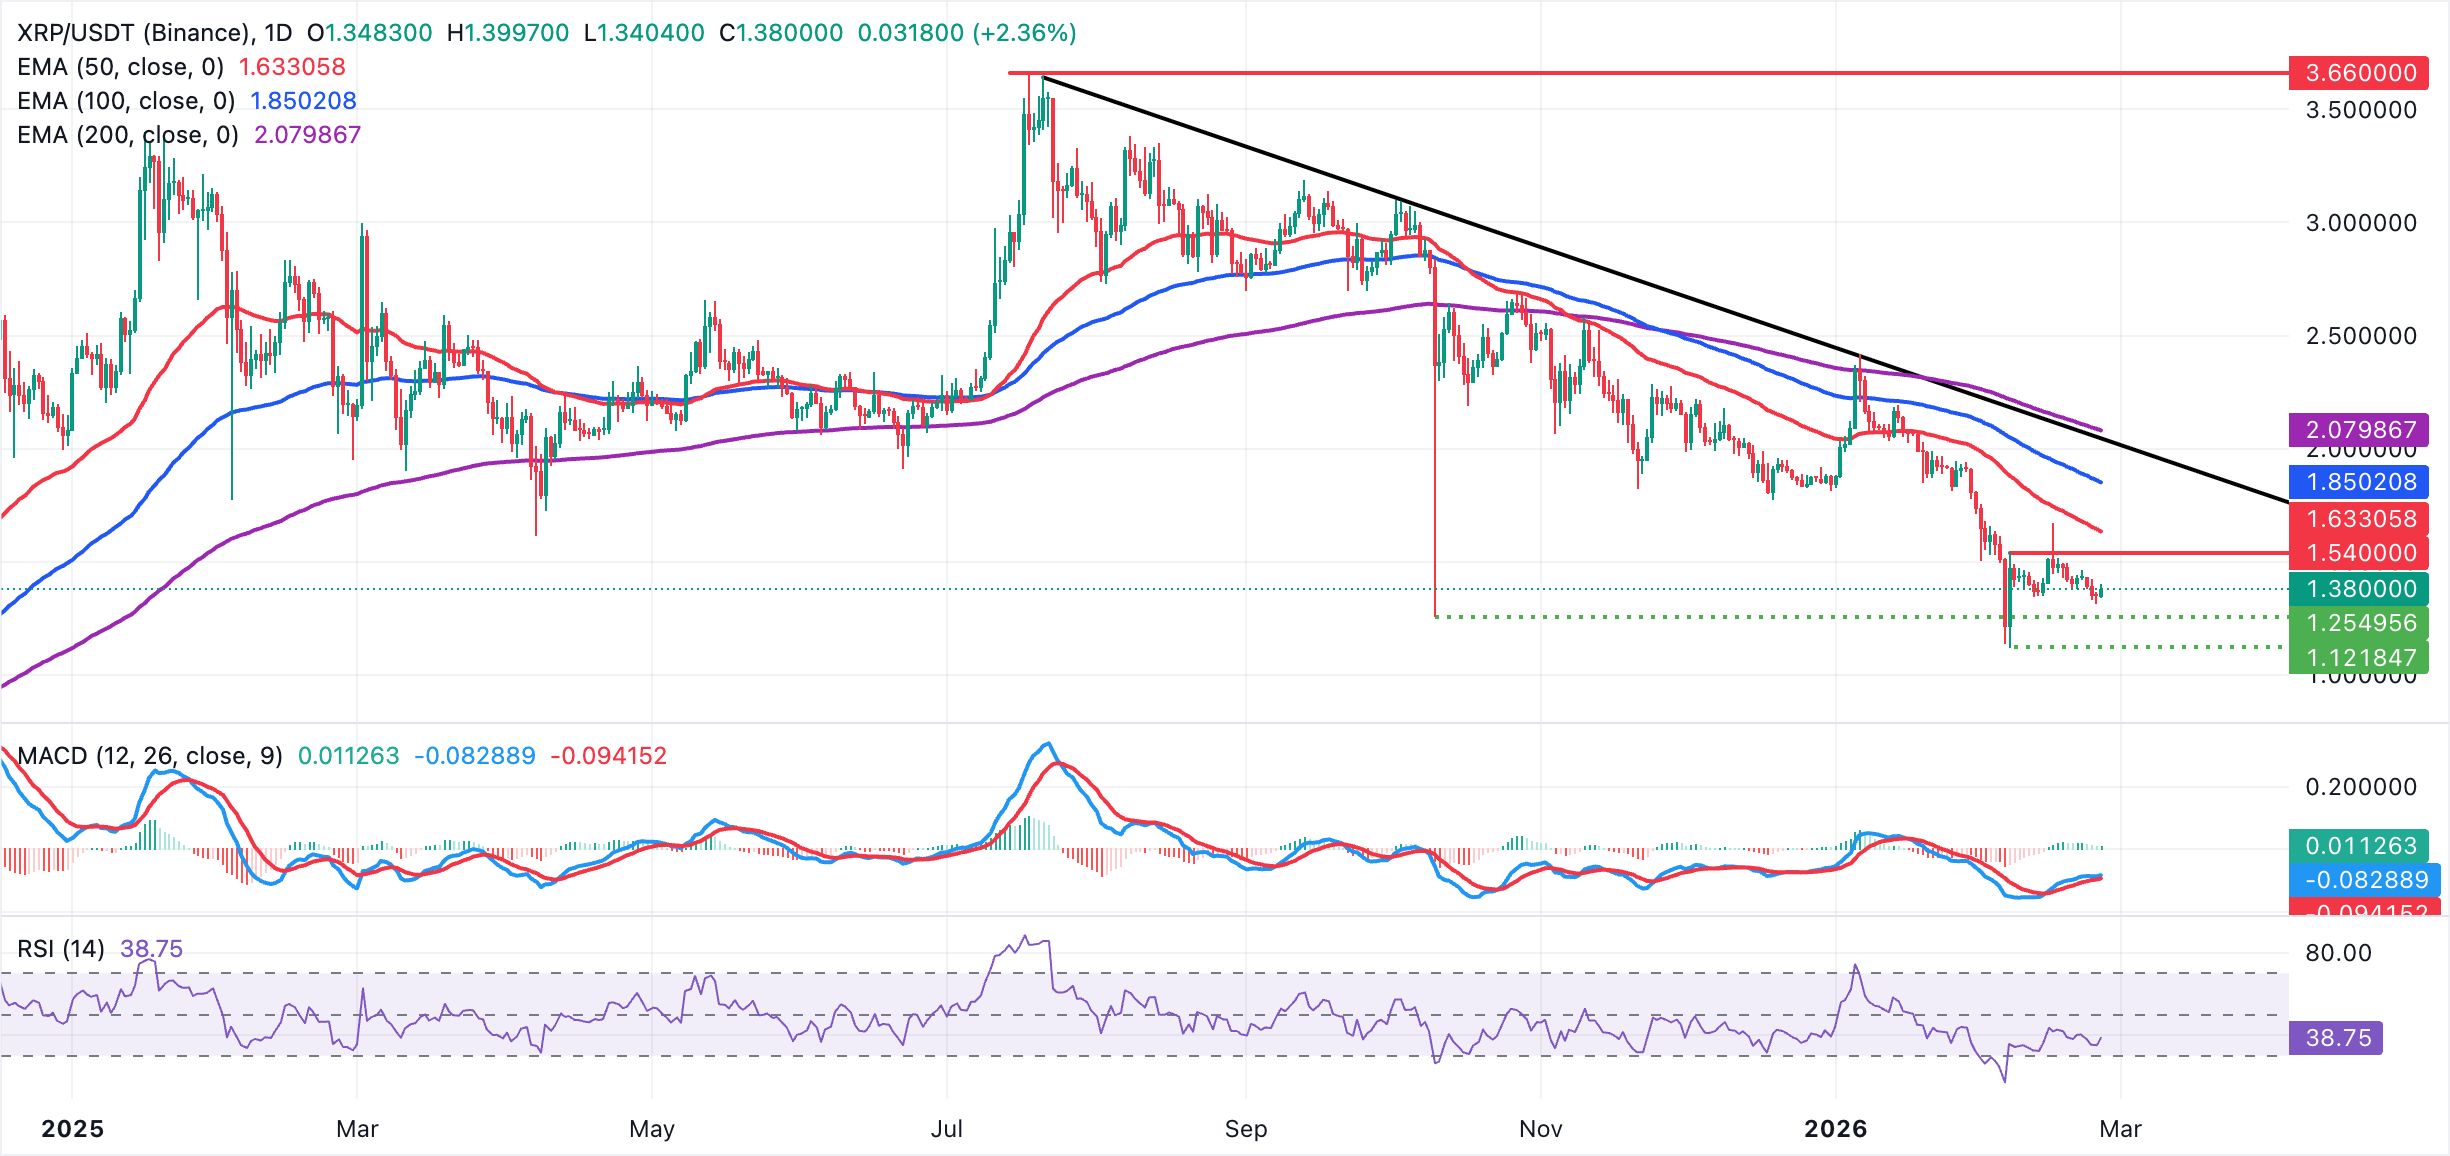
The MACD line has turned marginally positive above its signal line, hinting at improving but still fragile upside momentum. At the same time, the RSI around 39 remains below neutral, reinforcing lingering selling pressure and tempering the scope of any immediate recovery.
Initial resistance is seen near $1.51, where recent swing highs roughly coincide with the February 6 high at $1.54. A daily close above this level would open the path toward the 50-day EMA at $1.63.
Cryptocurrency metrics FAQs
The developer or creator of each cryptocurrency decides on the total number of tokens that can be minted or issued. Only a certain number of these assets can be minted by mining, staking or other mechanisms. This is defined by the algorithm of the underlying blockchain technology. On the other hand, circulating supply can also be decreased via actions such as burning tokens, or mistakenly sending assets to addresses of other incompatible blockchains.
Market capitalization is the result of multiplying the circulating supply of a certain asset by the asset’s current market value.
Trading volume refers to the total number of tokens for a specific asset that has been transacted or exchanged between buyers and sellers within set trading hours, for example, 24 hours. It is used to gauge market sentiment, this metric combines all volumes on centralized exchanges and decentralized exchanges. Increasing trading volume often denotes the demand for a certain asset as more people are buying and selling the cryptocurrency.
Funding rates are a concept designed to encourage traders to take positions and ensure perpetual contract prices match spot markets. It defines a mechanism by exchanges to ensure that future prices and index prices periodic payments regularly converge. When the funding rate is positive, the price of the perpetual contract is higher than the mark price. This means traders who are bullish and have opened long positions pay traders who are in short positions. On the other hand, a negative funding rate means perpetual prices are below the mark price, and hence traders with short positions pay traders who have opened long positions.
(The technical analysis of this story was written with the help of an AI tool.)
Author

John Isige
FXStreet
John Isige is a seasoned cryptocurrency journalist and markets analyst committed to delivering high-quality, actionable insights tailored to traders, investors, and crypto enthusiasts. He enjoys deep dives into emerging Web3 tren



