|

GBP/USD Price Analysis: Advances to near 1.2550 with expectations of a momentum shift

  • GBP/USD gains ground as technical indicators suggest a momentum shift for the pair.
  • The momentum indicator could confirm a weakening of the bearish bias once it breaks above the centerline.
  • The pair could meet the immediate barrier at the upper boundary of the descending channel around 1.2570 level.

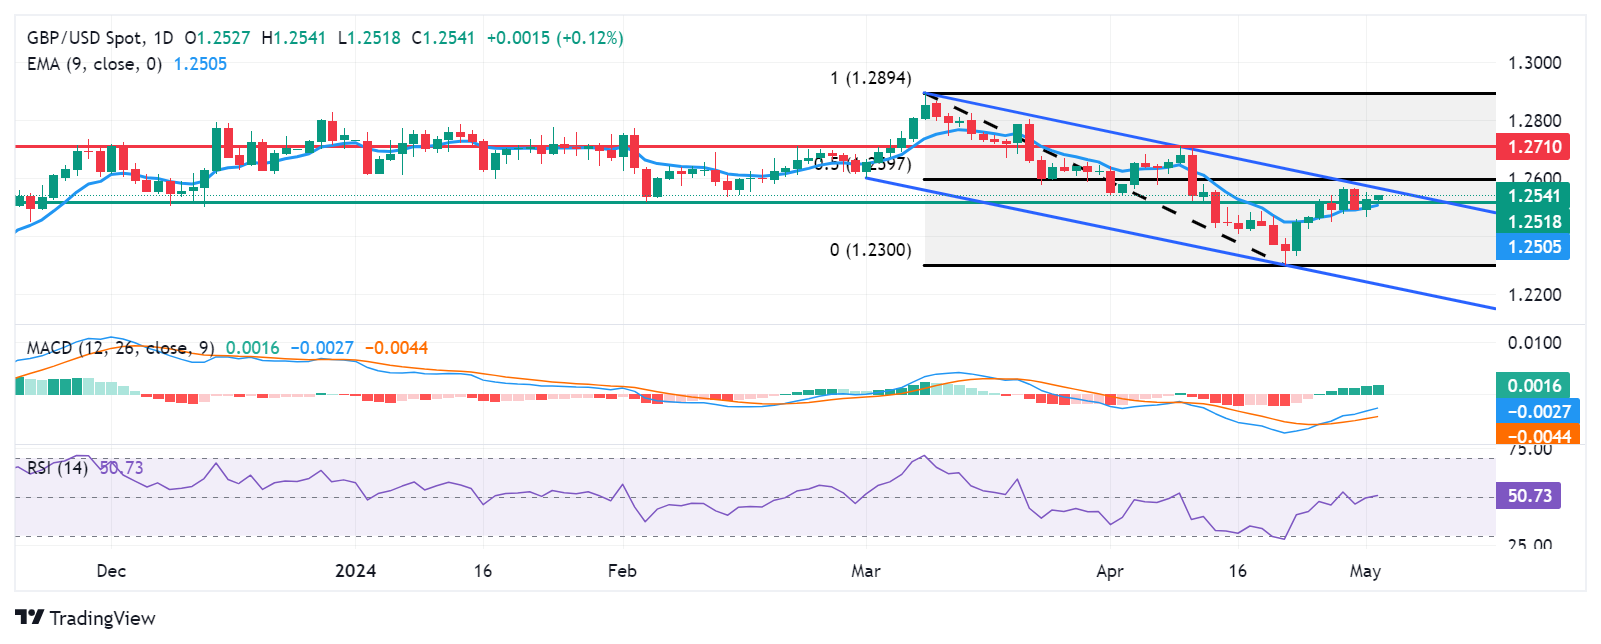
GBP/USD extends its gains for the second successive session on Thursday, trading around 1.2530 during the Asian session. The pair consolidates within the descending channel on a daily chart, with the 14-day Relative Strength Index (RSI) positioning on the 50-level. A further increase will indicate the weakening of a bearish bias.

Additionally, the Moving Average Convergence Divergence (MACD) indicates a momentum shift as it is positioned above the signal line but below the centerline. This momentum indicator could confirm the weakening of the bearish bias once it breaks above the centerline.

The GBP/USD pair could test the immediate throwback support at the 1.2518 level, followed by the nine-day Exponential Moving Average (EMA) at 1.2504 and the psychological level of 1.2500. A break below this level could exert pressure on the pair to navigate the region around the six-month low of 1.2300, followed by the lower boundary of the descending channel around the level of 1.2240.

On the upside, the immediate resistance appears at the upper boundary of the descending channel around the level of 1.2570 followed by the 50% retracement level at 1.2597 level, plotting between the range of 1.2894 and 1.2300.

A breakthrough above the latter could support the GBP/USD pair to explore the area around the pullback resistance at the 1.2710 level.

GBP/USD: Daily Chart
GBP/USD

Overview
Today last price1.2535
Today Daily Change0.0009
Today Daily Change %0.07
Today daily open1.2526
 
Trends
Daily SMA201.2507
Daily SMA501.2618
Daily SMA1001.2648
Daily SMA2001.2551
 
Levels
Previous Daily High1.255
Previous Daily Low1.2466
Previous Weekly High1.2542
Previous Weekly Low1.23
Previous Monthly High1.2709
Previous Monthly Low1.23
Daily Fibonacci 38.2%1.2518
Daily Fibonacci 61.8%1.2498
Daily Pivot Point S11.2479
Daily Pivot Point S21.2431
Daily Pivot Point S31.2395
Daily Pivot Point R11.2562
Daily Pivot Point R21.2598
Daily Pivot Point R31.2646

Author

Akhtar Faruqui

Akhtar Faruqui is a Forex Analyst based in New Delhi, India. With a keen eye for market trends and a passion for dissecting complex financial dynamics, he is dedicated to delivering accurate and insightful Forex news and analysis.


More from Akhtar Faruqui
Share:

Editor's Picks

AUD/USD turns south toward 0.6900 as USD firms up

AUD/USD sees fresh selling and drops toward 0.6900 in late Asian trading on Monday, as renewed US Dollar strength weighs on the pair amid lingering Middle East and Russia-Ukraine geopolitical tensions. Focus remains on Oil prices, Treasury bond yields, and RBA expectations for fresh trading impetus in the major.

USD/JPY retakes 158.00 amid hawkish BoJ bets, firmer USD

USD/JPY erases losses and retakes 158.00 in the Asian session on Monday, trading within a one-week-old range. Geopolitical uncertainty continues to underpin the US Dollar, despite fading Fed rate hike hopes, supporting the pair's rebound. However, further upside could be capped by hawkish BoJ expectations and looming intervention risks that could support the Japanese Yen.

Gold treads water around $4,150

Gold now regains some composure and approaches the $4,150 mark per troy ounce late on Monday. The precious metal’s vacillating price action comes in response to the persistent advance in the US Dollar in combination with the resurgence of the upside momentum in US Treasury yields across the curve.

Crypto Today: Bitcoin rally slows while Ethereum and XRP extend recovery amid slowing ETF inflows

Bitcoin is narrowly consolidating while trading above $86,000 at the time of writing on Monday. Altcoins, on the other hand, show a positive outlook, with Ethereum edging higher above $2,700 while Ripple steadies above $1.52.

Eurozone inflation just hit 3.8%, its highest in three years. This chart shows why the ECB can’t simply hike its way out

The ECB would normally have a relatively straightforward answer to inflation running almost twice its target: raise interest rates. But these are not normal circumstances. This time, the bond market is already doing part of the tightening for it, leaving the ECB facing an increasingly difficult dilemma.

Eurozone inflation just hit 3.8%, its highest in three years. This chart shows why the ECB can’t simply hike its way out

The ECB would normally have a relatively straightforward answer to inflation running almost twice its target: raise interest rates. But these are not normal circumstances. This time, the bond market is already doing part of the tightening for it, leaving the ECB facing an increasingly difficult dilemma.














