|

GBP/USD Price Analysis: Above 21-day SMA amid bullish MACD

  • GBP/USD registers five-day winning streak, probes 50% Fibonacci retracement.
  • A clear break of 21-day SMA, bullish MACD favor buyers.
  • 200-day SMA, 61.8% Fibonacci retracement on the bulls’ radars.

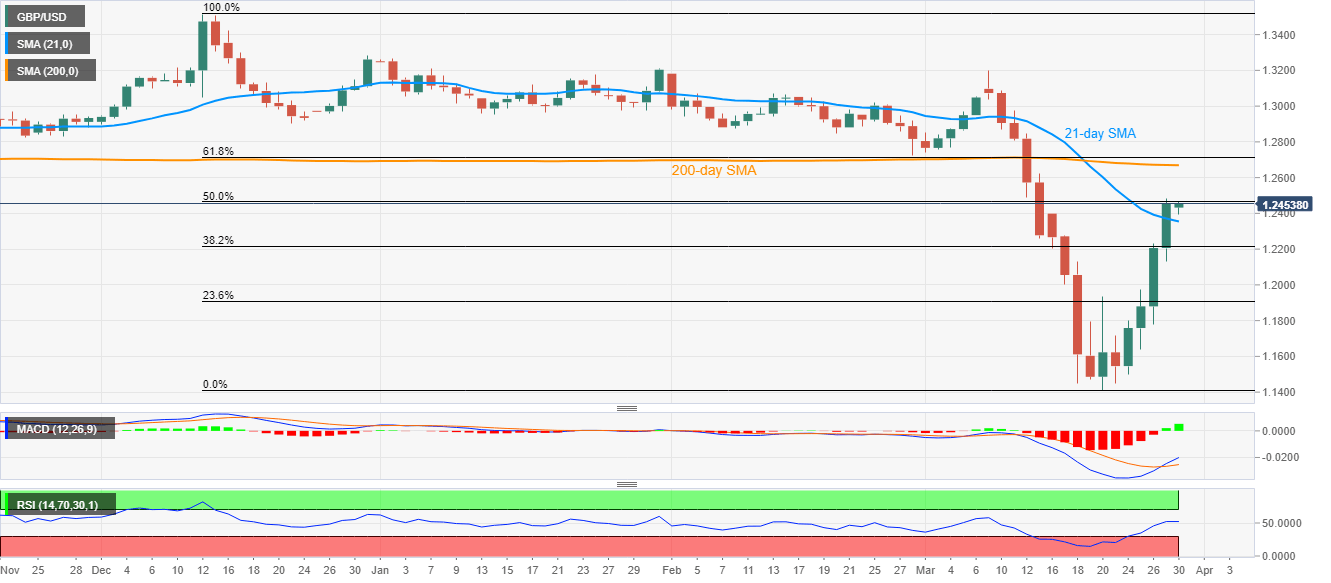
While extending its run-up beyond 21-day SMA, GBP/USD takes the bids to 1.2460 amid Monday’s Asian session. In doing so, the quote confronts 50% Fibonacci retracement of its declines from December 12, 2019, amid bullish MACD.

Although a clear break of 1.2470 mark comprising 50% Fibonacci retracement becomes necessary for the buyers to justify their strength, major attention is given to the 200-day SMA level of 1.2670 during the further upside.

Additionally, 61.8% Fibonacci retracement level of 1.2715 will also act as an additional challenge to the buyers.

Meanwhile, a daily closing below 21-day SMA level of 1.2355 could drag the quote to a 38.2% Fibonacci retracement level of 1.2217 ahead of highlighting 1.2000 mark for the sellers.

GBP/USD daily chart

Trend: Further recovery expected

additional important levels

Overview
Today last price1.2458
Today Daily Change4 pips
Today Daily Change %0.03%
Today daily open1.2454
 
Trends
Daily SMA201.2351
Daily SMA501.2737
Daily SMA1001.2886
Daily SMA2001.267
 
Levels
Previous Daily High1.2486
Previous Daily Low1.2133
Previous Weekly High1.2486
Previous Weekly Low1.1447
Previous Monthly High1.3204
Previous Monthly Low1.2726
Daily Fibonacci 38.2%1.2351
Daily Fibonacci 61.8%1.2268
Daily Pivot Point S11.2229
Daily Pivot Point S21.2005
Daily Pivot Point S31.1876
Daily Pivot Point R11.2582
Daily Pivot Point R21.271
Daily Pivot Point R31.2935

Author

Anil Panchal

Anil Panchal

FXStreet

Anil Panchal has nearly 15 years of experience in tracking financial markets. With a keen interest in macroeconomics, Anil aptly tracks global news/updates and stays well-informed about the global financial moves and their implications.

More from Anil Panchal
Share:

Editor's Picks

EUR/USD looks apathetic around 1.1770

EUR/USD comes under renewed pressure on Tuesday, deflating below the 1.1800 support and reversing two consecutive days of gains. The pair’s decline follows the persistent move higher in the US Dollar, as trade uncertainty dominates the sentiment ahead of President Trump’s SOTU speech.

GBP/USD regains 1.3500 and above

GBP/USD extends its advance for the third day in a row on Tuesday, this time retesting the area beyond the 1.3500 hurdle. Cable’s uptick comes despite decent gains in the Greenback and the dovish message from the BoE’s Bailey at the UK Parliament.

Gold appears offered around $5,150

Gold is giving back a good portion of the recent multi-day rally, receding to the $5,150 zone per troy ounce amid the decent bounce in the US Dollar and mixed US Treasuty yields. In the meantime, markets’ attention remain on upcoming comments from Fed speakers.

Ripple’s DeFi shift in focus: Navigating XRPL EVM sidechain growth, XRPFi migration and liquidity

Ripple (XRP) has continued to trade under pressure, extending its decline by approximately 63% from the record high of $3.66 in July. The remittance token is trading above support at $1.35, while its upside appears limited by key supply zones, starting with $1.40, at the time of writing on Tuesday.

The Citrini report: How a debatable AI narrative can shake Wall Street

That AI-related headline alone was enough to rattle investors.US stocks slid sharply on Monday after a widely circulated Citrini Research memo outlined a hypothetical “2028 Global Intelligence Crisis”, warning that rapid AI adoption could push US unemployment into double digits as early as by mid-2028.

XRP pressured by weak ETF flows and declining retail interest

Ripple (XRP) is edging lower, trading above its intraday low of $1.32 at the time of writing on Tuesday. The decline from its weekly opening of $1.39 reflects heightened volatility in the broader cryptocurrency market, accentuated by tariff-triggered uncertainty.