GBP/USD Price Analysis: 20-DMA probes bulls near 1.2500 ahead of UK inflation
- GBP/USD grinds higher around weekly top after rising the most since October 2020.
- Monthly resistance break, firmer RSI keep buyers hopeful.
- Previous support line from December 2021 lures buyers.

GBP/USD bulls take a breather around 1.2500, after rising the most in 19 months the previous day. That said, the cable pair battles with the 20-DMA around the weekly top by the press time of Wednesday’s Asian session, while waiting for the monthly inflation data from the UK.
Read: UK CPI Preview: Inflation “apocalypse” priced in, GBP/USD has room to fall
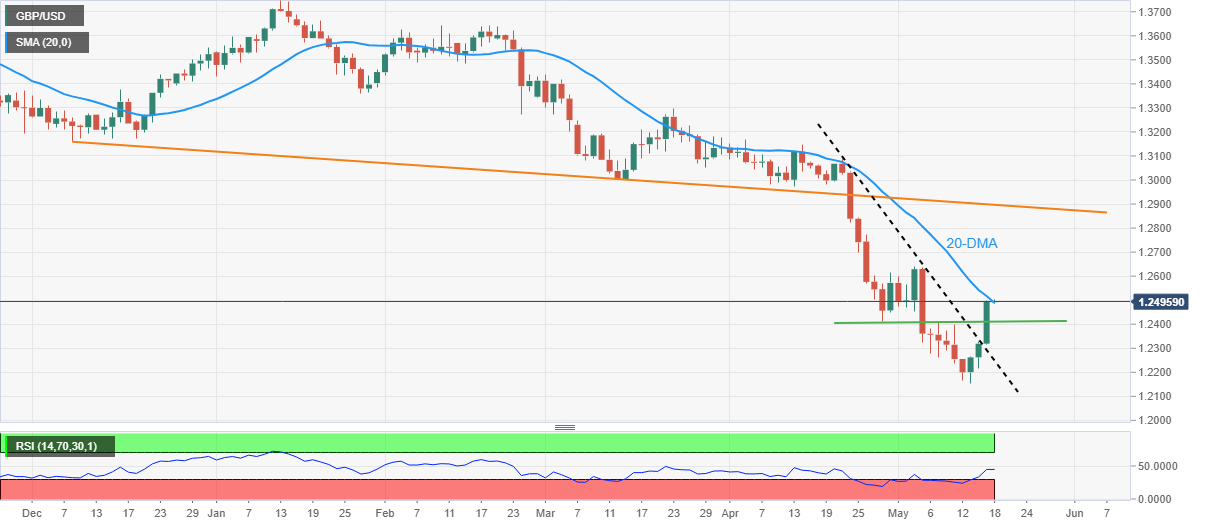
Although the 20-DMA level near 1.2500 tests the GBP/USD bulls, the cable pair’s ability to cross the one-month-old descending trend line, around 1.2250 at the latest, joins the firmer RSI line to underpin bullish bias.
That said, the quote presently aims for the monthly peak surrounding 1.2640 before approaching the support-turned-resistance line from late 2021, around 1.2900 by the press time.
On the contrary, two-week-old horizontal support around 1.2400 could restrict the short-term pullback of the GBP/USD prices before directing the bears toward the previous resistance line near 1.2250.
In a case where GBP/USD drops below 1.2250, a south-run towards the latest multi-month low of 1.2155 and the 1.2000 psychological magnet can’t be ruled out.
GBP/USD: Daily chart
Trend: Further upside expected
Author

Anil Panchal
FXStreet
Anil Panchal has nearly 15 years of experience in tracking financial markets. With a keen interest in macroeconomics, Anil aptly tracks global news/updates and stays well-informed about the global financial moves and their implications.


