GBP/USD jumps on worse than expected US economic growth report, pierces 1.3800
- GBP/USD approaches 1.3800 on broad US dollar selling across the board.
- US economy slows its growing pace, but inflation keeps rising.
- Fed’s favorite inflation measure rose by 4.5%, lower than the 6.1% of the previous quarter.

The GBP/USD rises sharply during the New York session, above the 1.3800 figure, trading at 1.3803 at the time of writing. US mixed macroeconomic data trigger a dollar sell-off across the board. The US economy is growing slower than expected, contrary to rising inflation, showing no signs of peaking. The stagflation narrative clouds the market again.
During the Asian and European session, the GBP/USD seesawed near the bottoms of the day, around 1.3720, towards 1.3770, until stabilizing around current levels after the US GDP announcement.
US Q3 Gross Domestic Product grew 2% lower than the 2.7% estimated
An absent UK economic docket was no excuse for sterling to climb, helped by the risk-on market sentiment in the financial markets. Also, it got a boost due to the US Gross Domestic Product for the Q3, rising at a 2% pace, lower than the 2.7% estimated by analysts, leaving economists guessing if the bond-tapering announcement would spur a sharper US economic deceleration.
Further, the PCE, Fed’s favorite measure of inflation, remained elevated, increasing by 4.5% in the Q3, after a 6.1% bounce in the prior three months.
However, not everything is negative out of the US. The US Initial Jobless Claims rose to 281K, lower than the 290K expected by analysts, dropping for the third consecutive week. The labor market shows some signs of coming back to life, despite recent disappointments on the US Nonfarm Payrolls report.
Meanwhile, US Home Pending Home sales declined by 2.3% for September on a monthly basis, following the August reading that witnessed an increase of 8.31%, as reported by the US National Association of Realtors
That said, investors’ focus shifts to the next week when the Federal Reserve and the Bank of England will reveal their monetary policy statements. The market expects a bond-tapering announcement by the Fed. Concerning the Bank of England, investors have priced in an 80% chance of a hike rate by the November meeting.
GBP/USD Price Forecast: Technical outlook
Daily chart
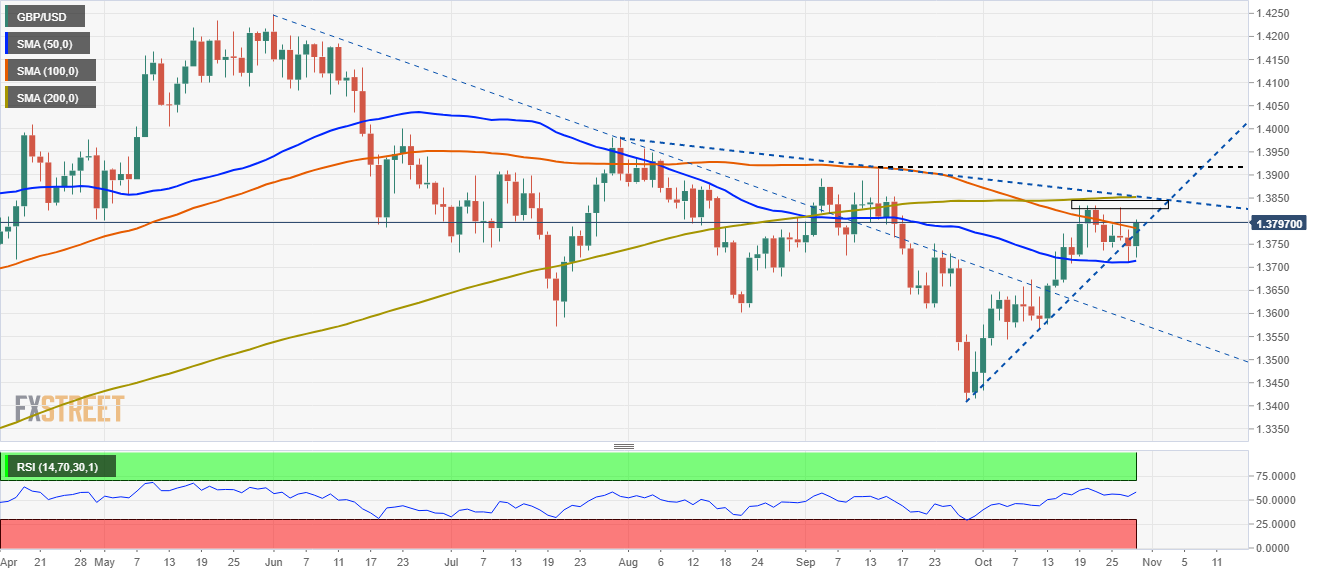
The GBP/USD has been trading within the 1.3700-1.3830 tight range in the last nine days, indicating no clear direction on the pair. The daily moving averages (DMA’s) act as support and resistance levels, as they remain trapped around the abovementioned area.
At press time, the spot price is above the 100-DMA lying at 1.3784, acting as support. Furthermore, a rising upslope trendline travels below the September 29 low towards the October 12 low, adding another support level for the GBP/USD. If it is broken, it would be a strong bearish signal for GBP/USD traders.
On the flip side, the pair would find strong resistance at 1.3800 and 1.3830. It is worth noting that the abovementioned level has been unsuccessfully tested four times, so GBP/USD traders should be aware of that. A break above 1.3830 would expose the 1.3900 as the next target for GBP/USD buyers.
Author

Christian Borjon Valencia
FXStreet
Markets analyst, news editor, and trading instructor with over 14 years of experience across FX, commodities, US equity indices, and global macro markets.


