GBP/USD extends backslide for Friday, aimed for 1.21
- The GBP/USD is continuing Thursday's losses, dropping towards the 1.2100 handle heading into the week's close.
- Friday's early bounce gave way to further red on the charts, with Sterling bidders finding little support.
- Sterling traders will be looking ahead to Tuesday's wages and employment figures for the UK.

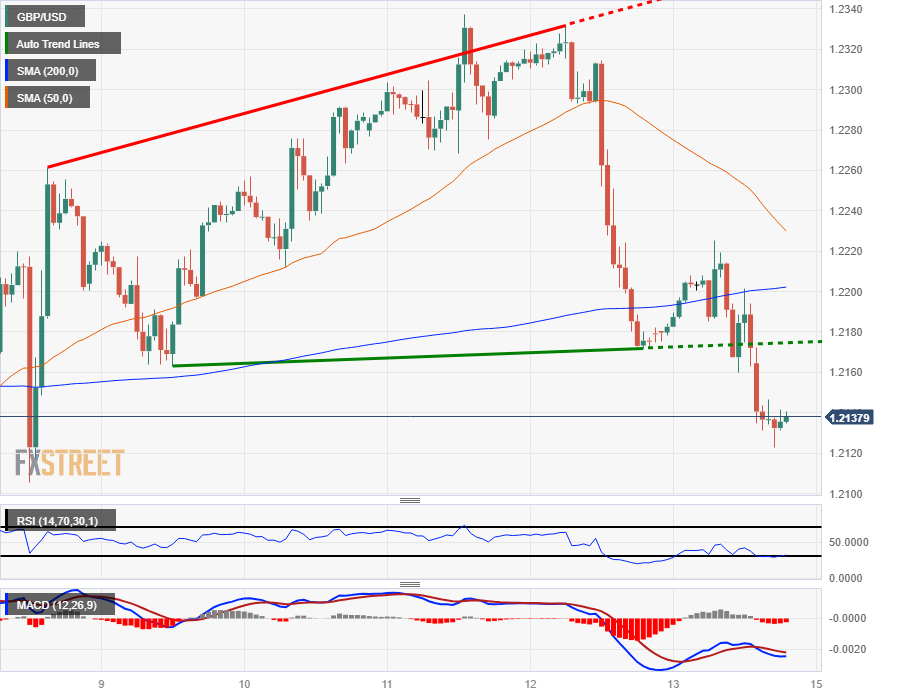
The GBP/USD slipped further on Friday, seeing a mild intraday rebound into 1.2222 before slumping back into fresh lows for the week and tapping 1.2122. With broader markets favoring the US Dollar (USD) on risk aversion sparked by Federal Reserve (Fed) rate fears, the Pound Sterling (GBP) is struggling to find a bid heading into Friday's market close.
The GBP/USD rose steadily through the first half of the trading week, marking in a high of 1.2337, but gains were to be short-lived after Thursday's US inflation-fueled broad-market dog-pile back into the US Dollar, sending the GBP/USD back into the red for the week.
Next week will see plenty of action for both the Pound Sterling and the US Dollar, with Tuesday's double-feature of UK labor figures and a US retail sales update.
The UK's Employment Change for August is expected to moderate, from -207K to -195K, while earnings (excluding bonuses) for the quarter into August are expected to hold steady at 3.8%.
Labor data for the UK will be followed up by an appearance from Bank of England (BoE) policymaker Dr. Swati Dhingra and another round of 30-year bond auctions.
On the Greenback side, US Retail Sales for September are forecast to see declines, from 0.6% to 0.2%, with Industrial Production for the same period seen similarly slipping from 0.4% to a scant 0.1%.
GBP/USD Technical Outlook
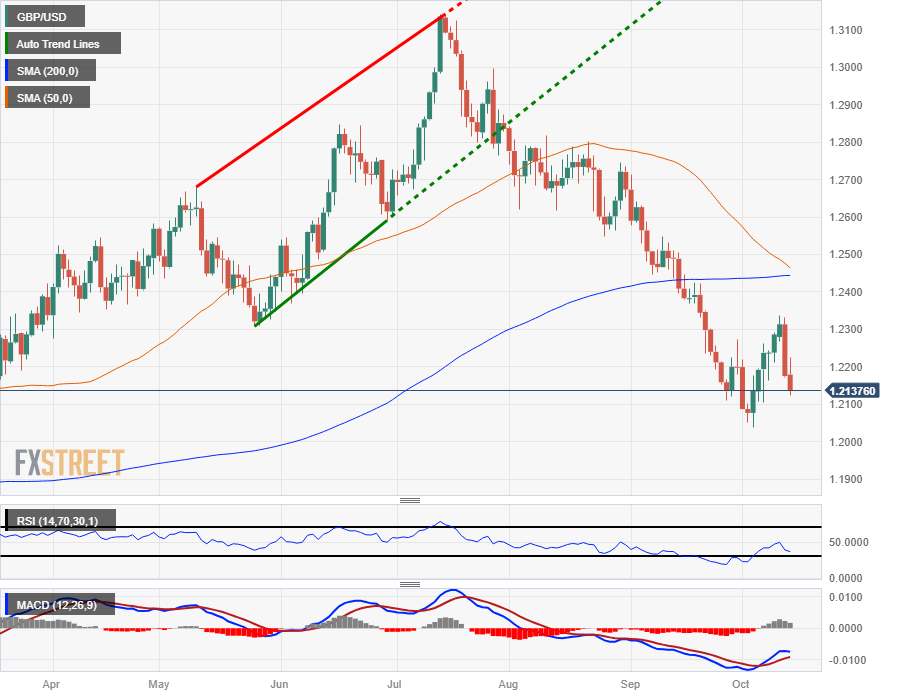
The GBP/USD is down 0.7% from the week's opening bids after taking a run at the 1.2100 handle, and the pair remains firmly off the week's highs of 1.2337, down over 1.6% from the top set on Wednesday.
The pair slipped the 200-hour Simple Moving Average (SMA) near the 1.2200 major level on Thursday, and the 50-hour SMA has near-term median prices accelerating declines, moving bearishly towards 1.2220 and set for a bearish cross if markets don't stabilize Pound Sterling bids.
Daily candles likewise show the GBP/USD trapped firmly in bear territory, with 2023's low bids sitting nearby at 1.1802. The 50-day SMA is set for a bearish cross of the 200-day SMA near 1.2450, with the Pound Sterling steeply off 2023's highs of 1.3142.
GBP/USD Hourly Chart
GBP/USD Daily Chart
GBP/USD Technical Levels
Author

Joshua Gibson
FXStreet
Joshua joins the FXStreet team as an Economics and Finance double major from Vancouver Island University with twelve years' experience as an independent trader focusing on technical analysis.
















